
Here are the courses prepared by students from the bachelor program ‘Frontières du Vivant’ in Paris Descartes University hosted by the ‘Centre de Recherches Interdisciplinaires’.


Ecology of population
Chiralité et diversité du vivant
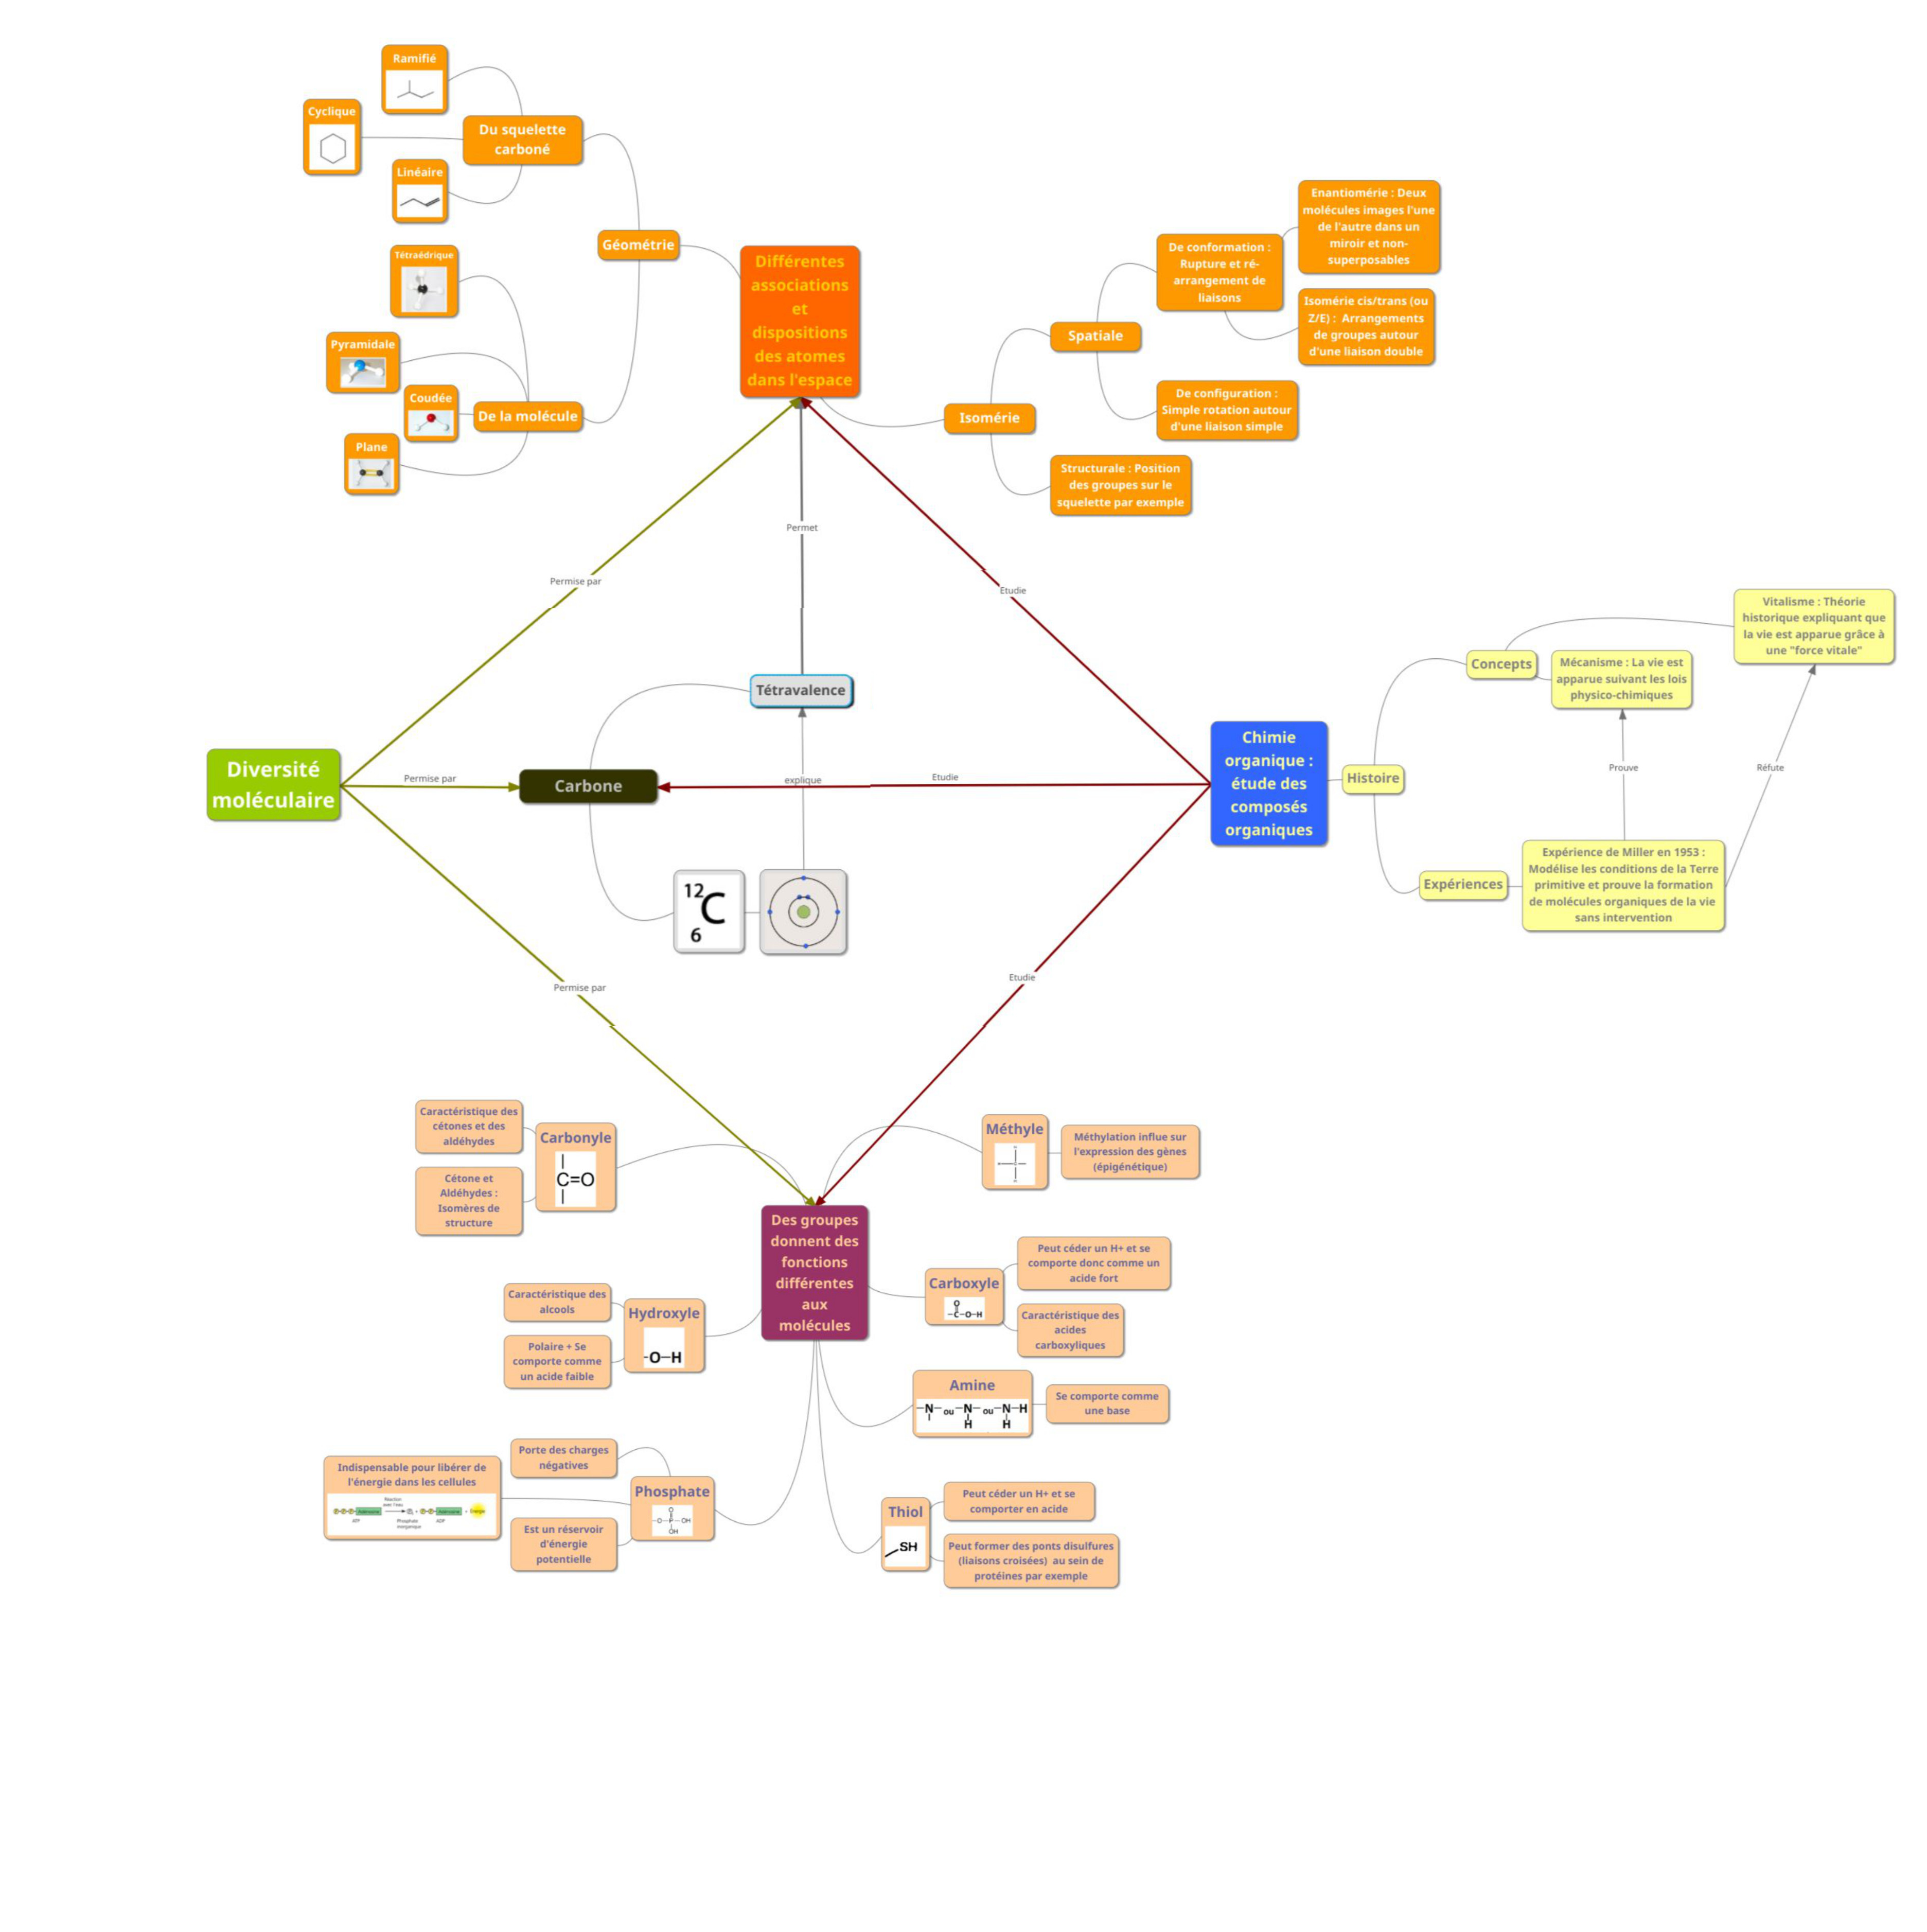
Question 1 : Pourquoi le carbone est-il autant présent dans le vivant et pas un autre atome capable de former 4 liaisons covalentes ?
(Jade, Anna, Antoine, Laurine)
Le carbone est défini comme formant les molécules du vivant. Pourtant le silicium est l’atome le plus présent dans la surface terrestre (jusqu’à 25% dans la croûte terrestre). On peut donc s’interroger sur la prédominance du carbone dans le monde du vivant.
La polyvalence du carbone, dû à ses 4 liaisons covalentes, lui permet de former de longues chaînes carbonées à l’origine de la diversité des molécules du vivant. Les liaisons du carbone à d’autres atomes sont également faciles à former et à rompre dû à une plus faible énergie. Par ailleurs le carbone élémentaire est insoluble dans l’eau
Pourquoi d’autres atomes, similaires aux carbone ne seraient ils pas capable d’être eux aussi à la base de la vie sur terre ?
En effet, le silicium est un exemple d’autre candidat potentiel pour le développement de la vie. Comme le carbone, il a la capacité de former 4 liaisons covalentes avec d’autres atomes. Cependant le silicium est un mauvais candidat pour des raisons physico-chimiques. En effet, à des températures extrêmes, le silicium ne permet pas de faire des réactions chimiques efficaces car les réactions de cette dernière sont fortement ralenties. En comparaison, à températures élevées, le carbone se lie à l’oxygène pour former le monoxyde ou le dioxyde de carbone. De plus, le silicium échange très difficilement ses électrons et refuse souvent de s’associer à d’autres atomes, ne pouvant ainsi pas participer à des échanges entre cellules. Ainsi, même si le silicium est plus présent sur terre, seulement 4 molécules ont été découvertes avec présence de silicium comparé au carbone qui compose près de 10 millions de composés organiques connus. Le carbone peut donc engendrer la création de beaucoup plus de molécules.
Ainsi, même si ce n’est « seulement » que le 4ème atome le plus présent dans l’univers, il reste une très grande base d’atomes de carbone sur terre et il possède des propriétés physico-chimique plus adaptées aux développement de la vie sur notre planète.
Question 2 : Comment la géométrie d’une molécule peut elle influer sur ses propriétés biochimiques ?
(Nyniane, Rita, Laura, Junghee)
Certaines molécules ont la même formule brute mais une disposition dans l’espace différente: c’est ce qu’on appelle l’isomérie. La géométrie des molécules peut être impactée par l’isomérie de ces dernières.
L’agencement des éléments dans les molécules peuvent avoir un impact sur leurs propriétés biochimiques.
Certains récepteurs biologiques seront ainsi activés par certaines molécules, et pas d’autres. C’est le cas par exemple des complexes se formant entre une enzyme et son substrat. Si le substrat n’a pas la géométrie qu’il faut (c’est-à-dire si elle est coudée au lieu de tétraédrique), il ne sera pas reconnu par le site de reconnaissance de l’enzyme, et le complexe ne se créera pas. Cela peut être illustré par l’image d’une serrure et de sa clef. Par analogie avec l’image d’une clef dans une serrure, si la clef (le substrat) n’a pas la bonne “forme”, elle ne rentrera pas entièrement dans la serrure (l’enzyme), et on ne pourra pas ouvrir la porte (le complexe ne se formera pas).
Exemple des énantiomères :
Ces molécules sont difficiles à séparer, ayant des propriétés physico-chimiques identiques, mais pas les mêmes propriétés biochimiques. Elles peuvent donc avoir des effets drastiquement différents sur l’organisme:
- sur la santé: exemple de la thalidomide, médicament prescrit contre la nausée chez la femme enceinte, mais qui a eu un effet néfaste sur le développement des embryons, conduisant à des malformations, sur une erreur d’énantiomère
- sur nos sens: exemple du limonène dont l’odeur est perçue différente selon l’énantiomère choisi – citron pour l’un et orange pour l’autre.
Question 3 : Quelles sont les spécificités des cellules adipeuses ?
(Gaspard, Estelle, Ines)
Il existe trois types de cellules adipeuses :
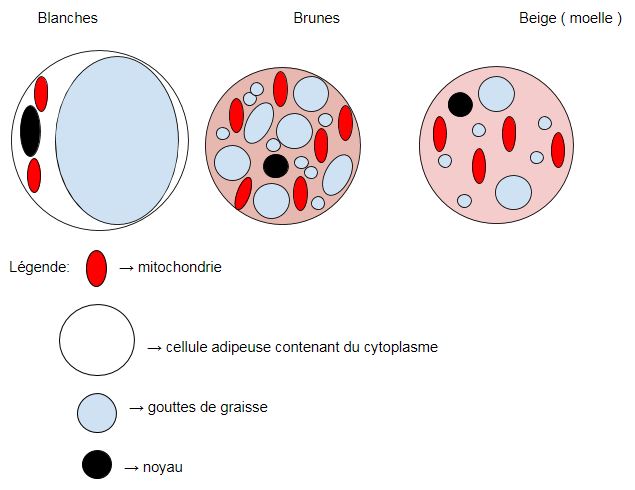
- La cellule blanche est la plus grande des adipocytes. Elle consistent en une vacuole, occupant la majeure partie du cytoplasme et stockant des lipides. Si elles accumulent trop de graisse, les cellules blanches se divisent par mitose. Un adipocyte blanc peut devenir beige en présence d’hormone (catecholamine) dans un environnement froid.
- La cellule brune remplit une fonction calorifique. Elle possède nettement plus de mitochondries et moins de réserves lipidiques.
- L’adipocyte beige se trouve dans la moelle osseuse et remplit une fonction de structure.
Question 4 : Comment la présence ou l’absence de certains groupes fonctionnels agissent-elles sur l’action des hormones sexuelles ? (ex : oestradiol / testosterone)(Cléo, Morgane, Nour, Paule)
Avant tout, rappelons le mécanisme de communication hormonale. Les hormones sont produites par des cellules endocrines, qui les libèrent ensuite dans le sang. Elles sont reconnues par d’autres cellules qui possèdent des récepteurs leurs correspondant. Se forment alors des complexes hormones/récepteurs. La fixation de l’hormone provoque une modification du métabolisme de la cellule. C’est le cas des hormones sexuelles : testostérone, oestrogène, à l’origine de la différenciation sexuelle.
On observe que la principale différence entre la molécule de testostérone et celle d’oestradiol se situe au niveau des groupements fonctionnels. Une liaison OH dans l’oestradiol se transforme en une liaison C=O dans la testostérone. La testostérone est en plus dotée d’un groupement méthyl.
Or, comme on peut le voir sur le schéma suivant, une hormone ne peut se fixer qu’à un récepteur spécifique et agit donc seulement sur une cellule cible spécifique, permettant une réaction ! Une cellule qui n’est pas cellule cible n’a pas les récepteurs adaptés à la reconnaissance de l’hormone : il n’y a donc aucune réaction qui en découle.
Ainsi, les différences de groupes fonctionnels citées plus tôt deviennent déterminantes lorsque ces hormones sexuelles se lient à des récepteurs différents car ne reconnaissant que l’un ou l’autre. Ce sont ces récepteurs spécifiques qui déclenchent des mécanismes en chaîne entraînant d’aussi grandes différences entre testostérone et oestrogène.
Le récepteur lié à l’oestrogène est appelé récepteur de l’oestrogène (ER), il en existe de deux types différents : ERalpha et ERbeta diffèrent en fonction du type d’organe ou du type de tissus dans lequel ils se trouvent. A noter que ces deux hormones ne sont pas exclusives et qu’il est possible pour un mâle de présenter un petite proportion d’oestrogène et inversement pour une femelle.
Sources:
- Biology, A Global Approach, Global Edition, 11/e
- Page Wikipédia “Stéroïde sexuel” – https://fr.wikipedia.org/wiki/Stéroïde_sexuel
- Clarisse Marie-Luce. Etude des mécanismes d’action mis en jeu par la testostérone dans la régulation du comportement sexuel mâle. Neurosciences [q-bio.NC]. Université Pierre et Marie Curie – Paris VI, 2012. Français. NNT : 2012PAO66527 . tel-00833257 https://tel.archives-ouvertes.fr/file/index/docid/833257/filename/Manuscrit-pdf.pdf
- Page Wikipédia “Testosterone” – https://fr.wikipedia.org/wiki/Testostérone#Lors_de_la_puberté_(garçons)
- Différence entre estradiol et œstrogène, site EsDifferent.com – https://fr.esdifferent.com/difference-between-estradiol-and-estrogen
Question 5 : Comment Miller a t il conçu et pensé le dispositif expérimental de son experience, et comment a t il analysé les résultats obtenus ?
(Gaëlle, Camille, Alix)
Il semble que Miller veut démontrer l’apparition de molécules organiques complexe, à l’origine de la vie, dans les conditions primitives de la Terre.
Miller modélise les conditions environnementales de la Terre primitive:
- L’eau bouillante à 100C° pour l’océan
- Le mélange gazeux avec les arcs éléctriques pour l’atmosphère et les éclairs
- Une colonne réfrigérante permet de refroidir le mélange gazeux, et de le refaire passer sous forme liquide, ce liquide retourne ensuite dans la ballon qui symbolise l’océan.
Cours géré par Clément Barbier- Gaïa Basinc- Alice Béchaux
Hello, I posted the revisions of 5 chapters. Please change the revisions accordingly. They were very nice to read.
The nervous system
by Lucas Goupil, Marie-Caroline Brichler and Gabriela Quintela
“Give me the ball !” said Jimmy. It is a beautiful summer day, birds are singing, the sky is blue and your brother is yelling at you because he wants the ball back. You took it from him and it is the first time that you realize it is actually you that voluntarily moved your arms. Yet, how did your consciousness managed to make your muscles to move?
You decide to run into your grandpa library and come nose-to-nose with that big book which appeals you. The secret of the Nervous System is written as its title, and it makes you think that the story is just beginning…
So, what is the nervous system? It is a computational and communicative system of specialized cells that quickly detects the environment, analyzes it, and moves the body in an appropriate manner and time. The nervous system is divided into two regions: the central nervous system (C.N.S) and the peripheral nervous system (P.N.S).The central nervous system is generally composed of the brain and the spinal cord. The other one is therefore considered to be placed on the periphery, because it concerns all the other nerves that runs throughout your body and nerves are composed of neurons that carry information from the C.N.S to the P.N.S.

Experiments (I will change the word experiments for illustrations or figures) highlighting that animals have two distincts symmetries, which corresponds to two different nervous systems. The radial symmetry (ex: jellyfish) describes a general distribution of neurons throughout the body which is called neural net. On the other hand, animals that have a bilateral symmetry (like humans) have packed neurons in ganglia, the biggest one is called the brain.
Figure 0.A: Bilateral/Radial symmetry, made by Marie-Caroline Brichler
Biologists believe this difference in symmetry came because some animals, the bilaterals, went through a process called cephalization. This process means that gradually the neural nets is accumulated in one extremity of the body; as a consequence the body became polarized.
To go further, there are some differences between vertebrate and invertebrate animals who are bilateral. Vertebrates have a spinal cord inherited from the neural tube (in the ectoderm tissue) encased in a spinal column at the back of their bodies. Mammals, birds, lizards and fish are all examples of vertebrates. Invertebrates have on the contrary their evolving neural tube at the front of their bodies. Another difference is the degree of centralization of the nerves in the body.
After reading this introduction you decide to discover the mysteries of the Nervous System. It is important to keep in mind during this whole journey that this chapter is about discovering how do the neurons communicate and coordinate their actions throughout the body. You will firstly know more about the central nervous system, then the peripheral nervous system and finally a mysterious part to go further…
I. Central Nervous System
a) The brain: a key organ
The brain manages everything that we do, when we dream, do sport, play music… It is “an organ of soft nervous tissue contained in the skull of vertebrates, functioning as the coordinating center of sensation and intellectual and nervous activity” according to the Oxford Dictionary. Indeed, it is specialized into different parts that are specific in performing some tasks. It is protected by the skull and a blood-brain barrier which prevents the blood from getting into the brain.
By working specifically with the spinal cord, the central nervous system (C.N.S) sends and receives messages that will send a specific communication between the environment and us. Now, let’s go further into the discovery of the brain structure. At first sight, the brains seems completely the same on both sides of the two hemispheres that constitute it. The same way our hands look alike but do not perform the same tasks, our right and left hemispheres may seem to have the same structures but they do not perform the same functions.

This asymmetry of functions is called the lateralization of the hemispheres. Conventionally the left hemisphere manages the language and the right one controls spatial attention functions.
Figure 1.A: Schematic of the brain hemispheres and the Corpus Callosum, Made by Marie-Caroline Brichler.
The hemispheres are subjected to the decussation process which describes the fact that the nerves of the right part of the brain give orders to the left side of the body and the left part of the brain gives orders to the right side of the body. However it depends on the function of the nerves, indeed the level of decussation is variable. The decussation happens in the medulla, where the neurons of the brain switch their place like an X.
Add in box a comma after embryonic stage.

Those two hemispheres communicate thanks to the corpus callosum. This “bridge” therefore also allows the four main lobes of the brain placed in the cerebral cortex to communicate. The cerebral cortex located on the surface of the encephalum is often called grey matter (this definition is not accurate) which is on the outermost layer of the brain. More generally, the cerebral cortex is separated into three major areas which each corresponds to its three main functions, including the long-term memory:

Figure 1.B: Table of the areas of the cerebral cortex depending on the function and localization, made by Gabriela Quintela.
The anatomy of this one is composed of four cortical areas that all assure cognitive functions:

Figure 1.C: Table of the different lobes depending on their characteristics, made by Marie-Caroline Brichler.
On the figure below all the lobes as well as the somatosensory and the motor cortex are shown:

Figure 1.D: Schematic of lobes, limbic system and cerebellum of the brain, made by Marie-Caroline Brichler.
Change in box below by producing hormones.

In the center of the brain surrounded by the cortical areas, there is the limbic system. The latter acts as an anatomic and functional interface between the cognitive life (which concerns the knowledge) and the vegetative life (under the supervision of the nervous system).
Five parts compose the limbic system :
- The Thalamus : it relays sensory information coming from the sensory organs by sending those to the lobes, which will then send the information to the cortex after processing it. For example the visual information coming from the eyes is sent to the thalamus which will relay it to the occipital lobe, and finally it will go into the cortex. However, smell is the only sense not processed by the thalamus so it can never be shut down.
- The Hypothalamus : motivational behavior about sex, sleep, thirst, hunger, through the control of glands and manages the hormone-secreting gland called pituitary gland.
- The Hippocampus concerns the short-term memory.
- The Amygdala manages fear and emotional memory, and the cingulate cortex triggers cognitive and emotional processing.

Figure 1.E: the limbic system, ventricles, the hindbrain and the brainstem, made by Gabriela Quintela.
On one hand, the medulla, pons and the reticular formation are all part of the brainstem which corresponds to the trunk that links the spinal cord to the brain. This part is therefore vital for life-sustaining functions.
On the other hand, the hindbrain or rhombencephalon is composed of 4 parts, which includes the brainstem and the cerebellum:

Figure 1.F: Table of the hindbrain and its four parts, made by Marie-Caroline Brichler.


Figure 1.G: Table of the pavlovian reflex experiment, made by Marie-Caroline Brichler.
Finally, the brain and the spinal cord are supplied by a transparent and biological liquid: the cerebrospinal fluid. It runs through four ventricles in the human brain and flushes the liquid to some following others by circulating one after the other. The first two ventricles are called lateral ventricles, they are outside of the limbic system. The third ventricle is among the left and right thalamus in the limbic system, and the fourth one is at the back of the pons in the hindbrain. Concerning the spinal cord, the cerebrospinal fluid runs through the central canal.
This fluid acts as a buffer for the brain, provides basic mechanical and immunological protection as well as nutrients to the brain and its vital functions.

b) The spinal cord

The spinal cord is protected by the spine, and more precisely the vertebrae (26 in humans), measures 42 cm long and begins from the end of the brainstem until the bottom of the spine. It is a part of the Central Nervous System, is constituted of neurons and is responsible of the transmission of the nervous message from the brain to the rest of the body.
Figure 1.H: The spinal cord and its three domains
Some disks composed of cartilage are located between the vertebrae, which help amortize the spine and give it flexibility. There is also an opening between vertebrae named intervertebral foramen where 31 spinal nerves emerge. Those spinal nerves send motor and sensory signals between the Central Nervous System and the rest of the body.

The spinal cord offers two exits to the nerves:
Ventral root: Called the anterior root, where the efferent (or motor) axons bring motor information from the brain to the body.
Dorsal root: Also called the posterior root, where the afferent (or sensory) axons bring sensory information from the body to the brain or the spinal cord.
The spinal cord is composed of two “matters”, like the brain:
White matter: it is in its periphery and it is composed of neurons’ axons which are myelinated, thus giving this color.
Grey matter: it is in the center of the spinal medulla, it is composed of neurons’ cell body in a butterfly-shape.

Figure 1.I: Schematic of the spinal cord, made by Marie-Caroline Brichler
In the grey matter there are the interneurons which are multipolar neurons that establish multiple connexions between afferent and efferent network.
Their cellular bodies are located in the spinal cord (CNS) and most of them are inhibitor of the efferent information. Indeed, they produce a characteristic neurotransmitter gamma- aminobutyrique acid, also called GABA.
For instance, when you are being bitten by a cat, your body wants to remove your hand as a reflex. The interneurons which send this sensory information of pain to the brain are able to inhibit the motor neurons because of your wish to not remove your hand.

Figure 1.J: Camembert of different types of neurons.
The mesencephalon, forebrain (brain) and spinal cord form the central nervous system. They create, analyze the information and transmit it to the peripheral nervous system.
II. Peripheral Nervous System
The peripheral system concerns all the peripheral neurons that are not in the brain nor the spinal cord.
They do originate in the spinal cord, but the main difference between these neurons and the ones constituting the brain lies on their physiology: the peripheral neurons have longer axons and dendrites because the distances inside the body are much longer than the ones that run through inside the brain.
Moreover the peripheral neurons are more myelinated than the ones in the central nervous system. This is explained by the fact that the myelin enhances the transmission of the electrical impulses, which is very important in order to have a quick communication between parts of the body that are far away from each other.
The peripheral nervous system is composed of two subsystems, the autonomic and the somatic ones.

Figure 2.A: Schematic of the global nervous system, made by Gabriela Quintela.
a) Autonomic system
The autonomic system controls every involuntary movement your body makes: as for example the famous experiment when a doctor hits your knee and then suddenly your leg goes up. It is itself divided into two systems: the sympathetic and the parasympathetic ones. However, some scientists and books consider a third division of the autonomic system: the enteric system. It is supposed to control the digestive system, meaning all its motor activities (such as throwing up) as well as secretions or vascularizations.

Let’s begin to study the sympathetic system: in situation of fear or intense danger, the fight-or-flight reaction is activated by the sympathetic system, as a reaction to stress.
Figure 2.B: Fight-or-flight reaction, made by Marie-Caroline Brichler.
What is the fight-or-flight reaction ?

The sympathetic system’s nerves emerge from the thoracic and lumbar spots in the spinal cord. To go further, some studies have proven that the peripheral immune system through its influence on the brain can modify someone’s reactions to stress and therefore potentially affect their vulnerability to mood disorders.

Now let’s focus on the parasympathetic system: it restores the body to a normal state, which is said to be a « rest and digest » state. Its nerves emerge from the cranial and sacral spots in the spinal cord.
Scientists consider parasympathetic and sympathetic systems to have opposite effects on each other. Indeed, the parasympathetic system restores the body’s homeostasis (meaning the process to resist changes in order to maintain an internal stability). It does so by activating the release of acetylcholine: the neurons are said to be cholinergic.
b) Somatic system
The somatic system controls the voluntary movements. It is therefore linked to the CNS thanks to the spinal cord. The neurons, as in the autonomic system, are separated into two categories : the sensory ones and the motor ones. In the autonomic system there is in most cases no connection to the brain, so the information just goes from sensory to motor neurons through the spinal cord as follows :

Figure 2.C: Illustration of the short and long reflex.

But in the somatic system, the sensory neurons transmit the sensory information to the C.N.S thanks to the interneurons, a motor one (the third category of neurons), which analyzes it and then send voluntarily another information.
We can also call the sensory neurons the afferent neurons (because they arrive into the spinal cord), and the motor neurons the efferent neurons (because they exit the spinal cord). Afferent neurons inform the CNS about conditions in both the external and internal environment of the body. The movements’ origin is located in what is called the neuromuscular junction.

The experiment of Claude Bernard consisted of using a curare bath where he tried to stimulate either the nerve or the muscle in order to determine if the neuron communicates to the muscle for motion action:

Figure 2.D: Table of Claude Bernard’s experiment, made by marie-Caroline Brichler.
The somatic neuromuscular junction is the ultimate relay between the motor cortex, which controls the excitation of skeletal muscle, and the mechanical response of the muscle, which results in physical movement.
The neuromuscular junction comprises mainly two cell types: the motor neuron and the skeletal muscle fiber which are separated by a gap called the synaptic cleft. The motor nerve terminal contains synaptic vesicles, filled with neurotransmitter, which release their transmitter into the synaptic cleft at multiple specialized sites called active zones, in response to action potential firing. Released transmitter acts at receptors on the muscle membrane, which occur in high‐density clusters at the peaks of muscle membrane in foldings called junctional folds.
Junctional folds are unique to the neuromuscular junction, increasing the reliability of transmission by localisation of acetylcholine receptors to the crests of the folds and enhancing the effect of depolarization by localisation of sodium channels in the troughs. Schwann cells are essential for the development and maintenance of the neuromuscular junction and play important roles in the remodeling and regeneration of damaged neuromuscular junctions.
Transmitter binding causes potentials which are caused by activity‐dependent release of multiple transmitter‐filled vesicles and trigger action potential firing in, and thus contraction of the muscle fiber. The neuromuscular junction is an accessible and relatively easy to study synapse that has led to tremendous progress in our understanding of synapses and in particular neurotransmitter release and continues to be a useful experimental model and educational tool.
Yet one question still remains: how did we discover all of that and how is the research being conducted today?
III. Going further into the nervous system
Science hasn’t always been that clear about the nervous system. Our knowledge of the nervous system have evolved across the years but have seen a great jump forward in the past 50 years thanks to the recent improvements in technologies that have permitted us to monitor the nervous system even more precisely. The great revolution in our understanding of its functions and mechanisms come from our recent ability to watch and monitor the nervous system in action in a non-invasive manner. Whereas in the 19th century, scientists made the first discoveries on the nervous system thanks to very invasive methods such as cutting wide open the head of someone.
a) Scientific methods used for studying the nervous system
Two techniques for clinical studies:


Five techniques for Mapping function:


b) Memory
Memory is composed of two parts; the short-term and long-term memory. However, since 2000 years, a debate among scientist about short-term memory is standing. A new system evolved from the concept of short-term memory that is the working memory. In summary, working memory is a combination of short-term storage of information and its manipulation. It should be used for complex cognitive actions that require both memory and processing, such as playing chess. The clear difference between short-term memory and working memory seems to be quite blurry for now as the two are still on occasion used interchangeably. A first model for working memory was introduced by A. Baddeley in 1992 in an article in Science magazine. This model lacked a part of the general mechanism that was later introduced (in 2000) by Baddeley himself: the Episodic Buffer.
For these both types of memories, the information is accessible via short term links formed in the hippocampus. When those memories need to be stored into the long-term memory, the short-term links in the hippocampus are replaced with more permanent links in the cerebral cortex itself. Studies show that this architectural memory happens mostly while asleep. The reactivation of the hippocampus needed to transfer the memories also seems to play a huge role in the formation of dreams.
It then appears that the hippocampus is needed for the creation of new long-term memories but not their storage. This is supported by the fact that patient suffering from damages to the hippocampus struggle to create new sustainable memories but remember very well things before their accident. They are, in a way, stuck in the past.
In terms of evolutionary advantages, we think that having different organisation in the 2 types of memories can enable memories to slowly merge with past knowledge and experiences to create more significant associations. This way, the association of new memories with old information already stored can benefit the transfer. This might explain why it is easier to learn a card game if we already know one, for example. Automatisms such as biking or walking, which don’t need a conscious effort, seem to create new neural links whereas memorisation of phone numbers, facts or places might depend on the strength of the neural connexions.

Figure 3.G: A revised model of working memory.
c) Controversies
When it comes to the origins of neural systems which are still quite unknown, scientists have established a main theory: every animal shares the same neural system in terms of organization, molecules transporting the information, etc. Phylogenetic studies had shown that the neural system evolved in the same way for every living organism on earth.

However, this theory was proved wrong by an outstanding article recently published, which has opened the debate on whether another type of neural system could have evolved in parallel from the one we know or not. The scientists at the origin of this controversy have focused on a particular marine creature, a comb jelly (Ctenophora). The genetic and metabolomic studies of this organism’s DNA have shown several incredible characteristics.
Figure 3. H: Pleurobrachia bachei, a model organism of the Ctenophora family, extracted from the quoted article.
First of all, the Ctenophora is one of the earliest lineage of the Metazoa (the Metazoa are all the animals composed of differentiated cells and a digestive cavity).

This means that on a phylogenetic tree their clade is one of the first to have appeared; as a consequence they should have less physiological characteristics. But this is not at all what this new study shows:
Figure 3.I: phylogenetic tree, extracted from the quoted article.
Moreover, their neural organization is quite different from what we know: Ctenophores do not use common neurotransmitters like serotonin, acetylcholine, dopamine… This study reveals that instead they use L-glutamate as their main neurotransmitter. They also have ion channels that are distinct from all other animals’ ion channels.
As the article brilliantly concludes : “ctenophores might represent remarkable examples of convergent evolution including the emergence of neuro-muscular organization from the metazoan common ancestor […]. The alternative ‘single-origin hypothesis’, where the common ancestor of all metazoans had a nervous system with complex molecular and transmitter organization including all classical cnidarian/bilaterian transmitters […] is a less parsimonious scenario. This hypothesis implies that ctenophores, despite being active predators, underwent massive loss of neuronal and signalling toolkits and then replaced them with novel neurogenic and signalling molecules and receptors.”
To come : interviews of scientists about the new ultrasound mapping technique and the vagal nerve.
I am missing the references.
Population ecology
By Zoé Picardat, Salomé Gastinel, Louisa Sudre-Rouffaux and Lucien Baccaini
Outline
1 – How to characterize a population
A – Characterisation as time goes on
B – Characterisation by the place
C – Characterisation through the others factors
2 – Relations with the environment
A – Between individuals of the same species
B – Between different species.
3 – Populations dynamics
A – Dynamic population model (Verhulst, Lotka-Volterra)
B – Studies of the different dynamics (let’s speak about fixed points and schedules)
C – Human dynamics
4) Lexicon
5) Conclusion
Australian Buffalo Toad
Australia is a place that is well-known for its biodiversity and its various types of ecosystems: from desert biomes to alpine heaths or even tropical rainforests. However, the Australian biodiversity is also widely known for being the country with the highest mammal extinction rate in the world.
This phenomenon occurred because Australia was a place that suffered from various importation of new species in the archipel. To give some examples, European rabbit (Oryctolagus cuniculus) which was introduced in 1857 for recreational hunting from Europe reached an estimated proliferation of more than 200 millions of individuals. Those rabbits are now causing problems to farmers because they are destroying lands due to breeding.
Another big example of invasive specie is the Cane toad (Rhinella marina). During the 1930’s scientists decided to introduce R marina in Australia as a biological control for cane beetle. At this period, Cane beetles caused a big threat to sugarcane crop’s leaves. Its extermination was very challenging because of the habits of cane beetles to bury their eggs and larvae underground. In 1935, more than a hundred cane toads were released in Queensland, in the north-east of the country.
The introduction of toads rapidly became a problem for the government, indeed its population reached more than 200 millions over the country, mainly on north-east regions. This development induced a disequilibrium between species that lived nearby: the back of the cane toad is toxic, thus, mammals such as northern quoll became endangered classified species: like various species of snakes, after eating those toads, the predator dies poisoned. Since the cane toad was declared invasive species all attempts to curtail the invasion have been unsuccessful.
This example underlines the importance of population ecology as a scientific discipline: learning about how species interact and how populations can develop in a non-native environment can be a solution to avoid those problems Australia is encountering because of not-well-thought species introduction.
The goal of this chapter is to understand what the characteristics of a population are and how ecologists can study populations. The interactions between the population and its environment (other population species and abiotic components/phenomenons) are also factors ecologists have to take into account in order to study a population. As we saw in the definition, population ecologists have to describe the actual distribution of species around the globe but also distribution of populations inside a species, as well as individuals inside populations.
I – What and how to characterize a population ?
A – Characterization as time goes on
Survival analysis
In the population’s study tools, one of the most basic one is the study of the age of a population according to three patterns. Those patterns have been summed up according to three curves: a function of the number of individuals surviving (log scale) according to the probability to survive until an age t (in percentage). It means that the x axis representant the lifespan of an individual as a percentage of the maximum life span.
The first curve representing the type I (in blue fig1) is the model followed by us humans is characterized by
- A low rate of mortality for the young individuals that increases for the oldest individuals.
- A great care to the young ones by the parents.
- In addition to this graphic, it is important to know that those species are made of populations with few descendants, compared to other species that follow the dynamics of type II or III. Those curves don’t represent the number of individuals of the population, but the survival rate during their lifetime. It is important to highlight that the number of progeny is not always representative of the number of progeny that will survive. In the case of humans, there is a few progeny but this is counterbalanced by the high degree of care from the parents.
The red curve (Fig 1.A.1) represents the type II (mices, birds):
- The mortality is constant. animals like birds or mice are characteristic of this type of survival curve.
The type III, green on the graph (Fig 1.A.1):
- The rate of mortality is greater in the first stage of development and then, decrease.
- No care to the descendants, it explains the important decrease of the slope at the beginning because the descendants have a low survival expectancy.

This graph is just a representation, we cannot deduce anything about the number of offspring, it only gives us clues about the studied model.
More precisely those curves are described in Weibull frequency distribution (see sources for more informations). However, despite the fact that this model (the Weibull frequency) is very efficient for species with long lifespans, it seems to have some difficulties to be exact when it comes to those that have shorter ones. And this is because many factors such as the mortality rate increase due to stochastic events (being or having random variables) such as the weather.
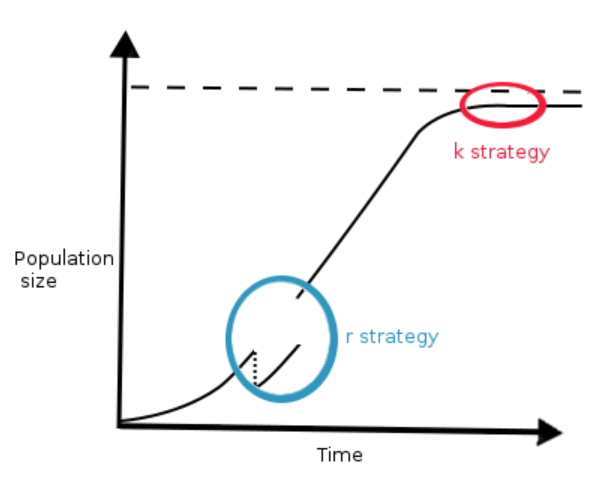
Those curves (Fig 1.A.2) represent survival strategies and hence different reproductive strategies. We are now going to explicite them:
K strategy (K comes from carrying capacity of a habitat) is a strategy adopted by populations that are described as predictable, stable. K is the density dependent interactions. Few points to recognize populations with K strategy:
- those populations have few descendants
- late sexual maturity, with parental care
- long life expectancy
- type I or II survivorship pattern in which most individuals live near to the maximum life span
- large size organism
r strategy (reproductive strategy, growth rate) is density independent. It can be characterised by:
- organisms with a small size (insects, invertebrates…)
- energy used to make each individual is low (Reproduction is easy)
- early maturity
- short life expectancy
- each individual reproduces only once
- type III survivorship pattern
In population ecology we study the evolution of mortality but also, the density of a population, its dispersion, the sex ratio…
This last criteria is important as this article : Age- and sex-specific response to population density and sex ratio explains us:
“Population density and sex ratio are important parameters shaping inter- and intrasexual competition (Emlen and 1977; Kokko and Rankin 2006) because they establish the rate at which individuals encounter competitors or potential mates”
Dreiss, Cote, Richard, Federici, & Clobert, 2010, p. 1
So what is sex ratio ?
Studying sex-ratio helps the researchers to determine when and how a population is going to evolve, it has great impact on populations dynamics.
For example, if a population maintains a ratio of 1 male for 1 female we can suppose that the evolution is going to be linear, a constant rate. And if there are more females than males, the population is going to increase because the growth rate will be more important.
An important point is that this parameters can be manipulated in some species. For example in the crocodile species the sex is determined by the temperature of the environment. If there is a crisis, the female can decide to set eggs more of less depending they need female or male individuals.
Population pyramid a tool for age sex representation
This tool allows us to compare the distribution of the population in function of the age and the sex. One of the output of this method is that we can determine some socio-economics events for the human dynamics (example bellow). There are three types of diagrams that we can underline:
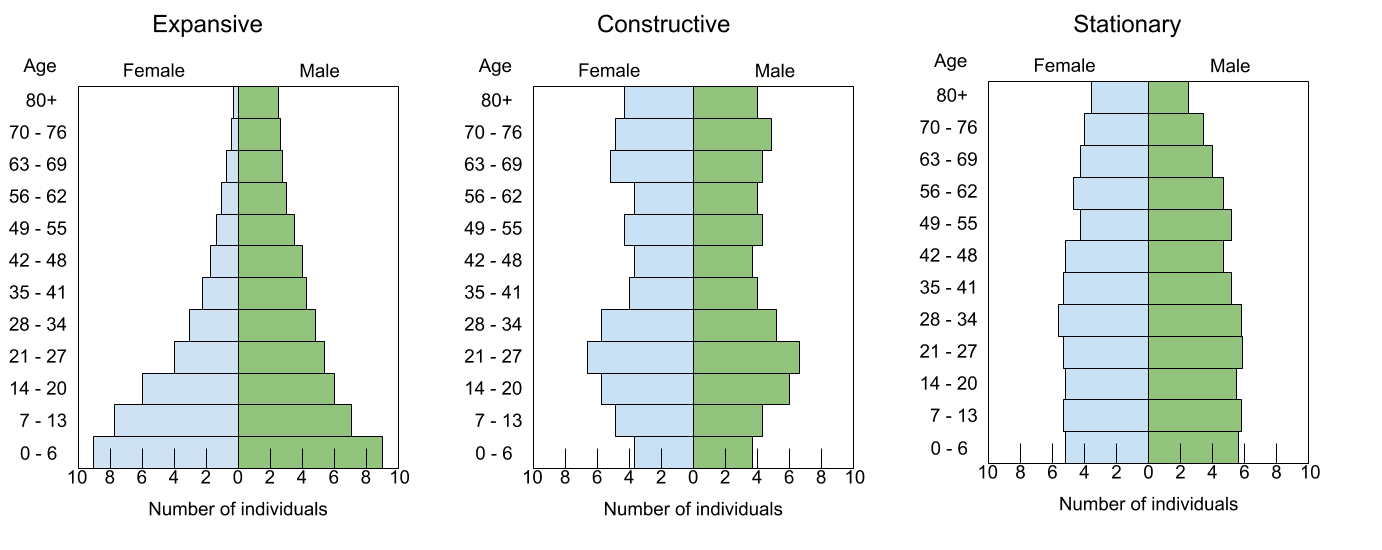
The stationary pyramids :
It is when there are as many births as deaths, so the population doesn’t evolve.
As we can see on the Fig.1.A.4, the width of the 0-14 years old group is the same one as the reproductive age group. It means that the population can control the birth rate more easily. Also, the relative height and the relative width of the pyramid’s top suggest that there is a low rate of death.
The expansive pyramid :
As the base is larger, there are more births than deaths. Usually, it is a characteristic of the short living population type. (semelparity for exemple / bigbang reproduction, )
The width of the base indicates an important birth rate and the biggest the base is, the tallest the pyramide is going to be. It also indicates that the population is mostly constituted of young people. Thus, a narrow and low top indicates an important death rate.

The constructive pyramid :
It is when there is a low rate of births and deaths at the same time. A characteristic of developed countries.
One of its characteristics is to have a wider reproductive age group than the 0-14 years old group. It means that the population does not renew itself, in the future it will maybe have a lower number of individuals.
B – Characterization by the area
We can’t talk of density without the notion of dispersion.
Density is the number of individuals per meter (surface) and the dispersion / distribution is how much those individuals are distant from one another.
The density factor has a huge impact on the perpetration of a population. Indeed, an individual of a large population has higher chances to mate and has more allele diversity.
Inside an area of repartition, the density can have an unequal distribution.
Distribution can be defined as the spatial fluctuation of the abundance of the organisms inside of their repartition area. It is interesting for biologists to study dispersion because it allows them to see social interactions between individuals but also their interactions with the environment.
There are 3 big types of distribution (equal, unequal and clumped). (see fig 1.B.1):
- The clumped / aggregated distribution is the most common : individuals are aggregated around ressources, or stay together to improve their survival rate.
- The equal / uniform distribution is rarer. It results from interactions between individuals (for example, a secretion that keeps others individuals away, or aggressiveness).
- The unequal / random one appears when there is no real attraction or repulsion between individuals of the same species, or when physical and chemical factors are homogeneous.

This density is not stable: it can be influenced by a lot of factors, such as the migrations of individuals inside a population.
Flux of population (emigration and immigration)
Indeed, the factors that make a population grow or not are not only the natality and mortality ones ; emigration (leaving your own place to settle down at another one) and immigration (“the action of coming to live permanently in a foreign country”) also have important impact.
Those factors can create a metapopulation.
“A meta-population is a “population of populations” distributed in discrete habitat patches that are linked by occasional dispersal”
A metapopulation can be seen as populations of a same species living in different “patches”, different areas but they are still interconnected, the genetic exchanges still exist between the different populations.
Thus, the dynamics of a metapopulation is directly influenced by the flux of individuals through these populations. It is the dispersion that makes them interconnected.
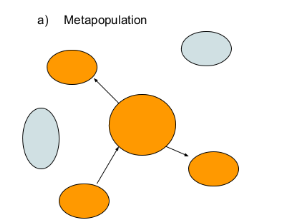
The following figure (Fig. 1.A.5) is going to help you visually understand the types of environmental distribution of a species.
Mathematical representation of metapopulation : The Levins model et BIDE model.
Abundance and distribution
Abundance can have two definitions:
- The first one is that the abundance of an organism is the total number of individuals.
- The second one refers to the definition of the density, the total number of individuals on a defined surface.
As we saw in the beginning of this first part, the abundance / density is a very important factor that can make the population fluctuate. During the rest of the chapter we are going to see that there are two more: the distribution and the dominance.
To continue on the abundance factor there is a precision that we have to make: the density can evolve thanks to two types of interactions:
- The biotics factors, intern factor of a population as cannibalism, reproductive rate…
- The abiotics factors, so the ones that are external to the population as the weather, the diseases…
To see more concret informations/models go to part 3. To have the definitions of some terms, go to the lexicon.
C – Characterization through the others factors
Now that we have determined all those notions we can study how these informations can be obtain.
How to obtain the informations necessary ?
To begin with, it is relevant to precise that it is very rare to have the exact number of individuals that composed a population and all the demographic factors. It would be long and expansive to catch ALL the individuals of a population (and we cannot be sure at all that we really caught ALL of them).
We are going to list the most common techniques that allow us to estimate the number of individuals among a population.
There are marking techniques such as birds bands, writing a number on butterflies’ wings, amputation…
Then we can analyse the size of the population thanks to the Lincoln Petersen estimator.

So we search the population size N. We recapture individuals after some time in a another place and we see the ratio of already marked individuals and the all captured sample. Thanks to that, we can estimate N.
Perhaps this technique of CMC (capture, mark, capture) presents some limits. For instance, we are unable to capture individuals from some species during a certain time of the year (life cycles), it is thus impossible to determine the survival rate of the juveniles. And as we have seen before, this is one of the most important factors (Fig 1.A.1)
Some equations have been created to reduce biases but we are not going to see them for this chapter.
You can see a concrete application of those studies : Spatially Explicit Population Model Read
II – Relations with the environment
To live, an individual within a specie needs to adapt to an ecosystem, to cohabit with other species and it needs to find resources. This create links between species within an environment and with the environment. The role that a specie has in this motion is called the niche.
A – Between individuals of the same species
Communication
Within a specie, individuals need to communicate to better function as a group. Several types of communication exist :
- Pheromones – chemicals. Pheromones, when secreted, trigger an chemical response in another individual. It can hold different information such as territorial information (when a dog pee on a bush to mark its territory).
- Auditory cues – sounds. Sound is a mean of communication used among many species of the animal kingdom. Birds use auditory cues to warn, mate, and coordonate behavior within a group.

- Visual cues. Visual cues can be behavioral or “badges”. Behavioral cues are sent when the behavior of an individual its behavior to convey an information. For instance a dog wag its tail to show that its happy. Badges cues are when an individual communicates using a structural adaptation. For example the poison dart frog is very colorful to warn its predator that it is dangerous to eat.
- Tactile cues – touch. When individuals communicate by touching each other. This type of communication is limited by its short ranged and can only unable a handful individuals to communicate. When in hive, bees move in a certain pattern when they found food to indicate the specific location to the bees nearby.
All of these means of communication allow individuals to mate, to defend territories, to coordinate behavior with other individuals…
Gene transmission
Species are constrained by the genetic drift and natural selection within their environment. In one specific setting one allele can be more advantageous than another, which gives the upper hand to the individuals carrying the allele and leads to a larger representation of the allele within the specie. From generation to generation a specie evolves to become more fit to its environment in order to have more chances of surviving. They are many different ways that a specie can evolve, one of them is the horizontal transfer of genes. Horizontal transfer of gene is the transfer of DNA between different genomes. It usually occurs between bacteria but it can occur between prokaryotic and eukaryotic cells.
B – Relation between different species.
A group of individuals of the same specie is called a population. When several population interact in a given area, it creates communities. Communities, interaction and area altogether creates an ecosystem. The scale of the given area varies a lot depending on what we want to study. We may want to understand what is the relationship between two specific populations.
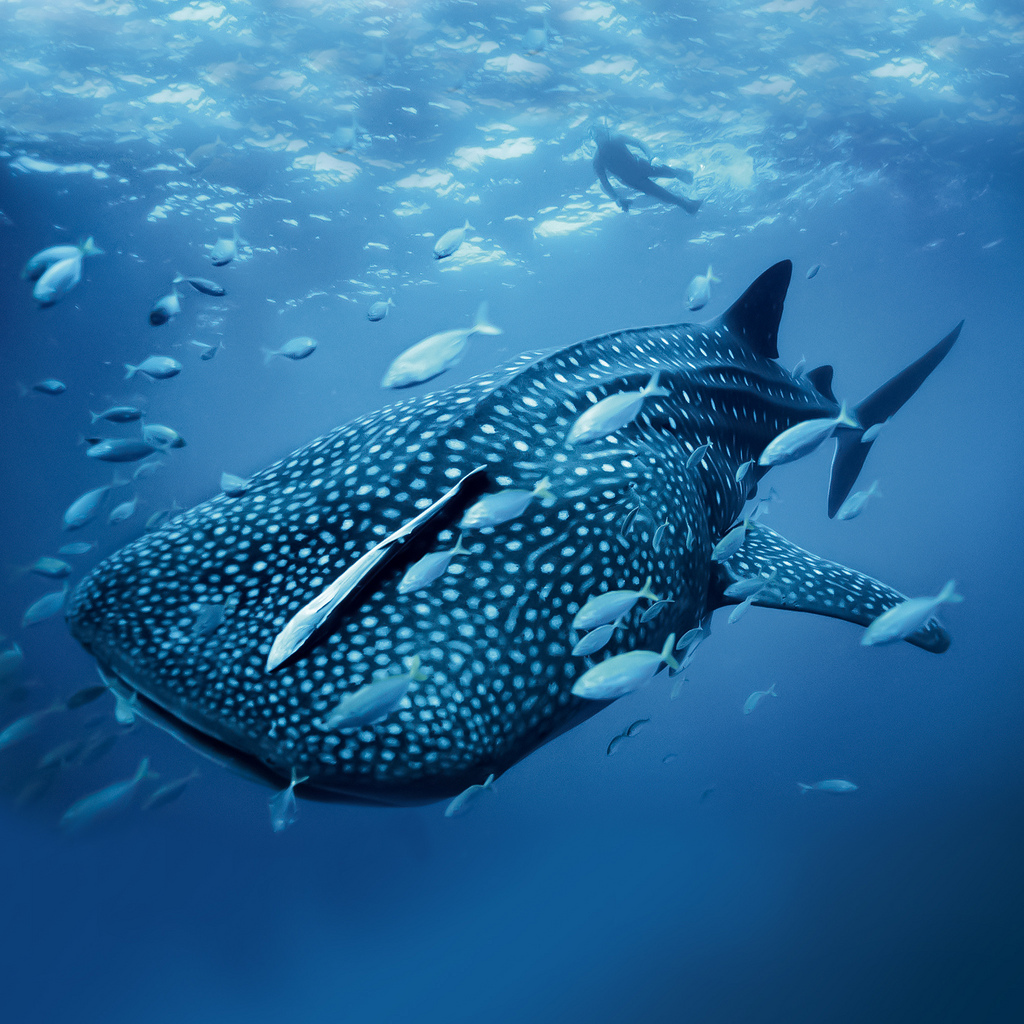
We saw how species communicate to defend themselves from other species but species can also use each other to gain. We call this symbiosis. A known example of symbiosis is cleaner fish : Bigger fish get clean by small cleaner fish ; cleaner fish get nourish by the parasites existing on the bigger fishes’ skin while the bigger fishes get clean.
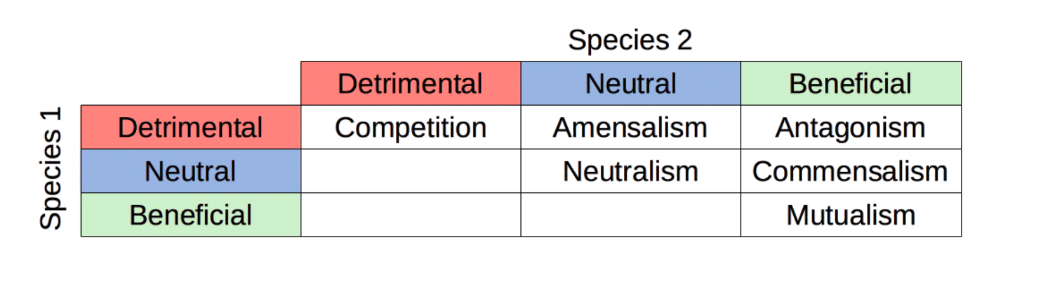
They are several types of symbiosis:
- parasitism: One organism take advantage of the other
- mutualisme: All of the parties involved are favored by this relationship
- commensalisme: One organism thrive while the other is neither helped nor harmed
For territorial animals, space is a valuable resource. Let’s see some examples of resources provided by a territory.
- Food:
It is particularly true for predators, because they need a large reserve of prey (which are distributed in a large area).
- Mating opportunities:
It is linked with the presence of females. Some males are in competition for females, and that depends on the repartition area of those females and males. sometimes it can be a group of females defended by some males (protection of mating areas). This allows them to increase their fitness (see the definition in the lexicon page).
- Nests and offsprings:
Finding nests and defending them will give a greater survival to their offsprings, which will also increase the fitness of the individual.
An individual chooses its territory in function of those resources. Depending on their disponibility, the area will be more or less large.
When two species needs the same ressources, they are in competition. The evolution of those species can be modelled by the Lotka-Volterra competition equation (you will see it in part 3).
The Gause Law says that 2 species that have the same needs (that have the same ecological niche, see the definition in the lexicon) cannot coexist because one of them, the more competitive, will eliminate the other. In other words, if two species similars in term of ecology coexists in the same environment, they have realized a differentiation of their niche.
III – Population dynamics
In the last part, we tried to explain what population is and what are the factors that can influence a population. But how can we quantify this influence ?
Here we will explain this quantification through the mathematical aspect of population ecology.
A – Dynamic population model (Exponential growth, logistic model, Lotka-Volterra)
In a first part, we will talk about two simple models : the exponential growth and the logistic model.
In a second part, we will speak about the Lotka-Volterra equations, which takes into account other populations and species
Exponential growth
Exponential growth describes the growth of a population in an ideal environment with unlimited resources and no predators or diseases. This model takes into account birth and death ratios only. Because it describes an ideal population we can use it as a reference, but it does not describes reality.
dN/dt=B – M=b N – m N =r N
Solution : N =C exp(r t)
- dNis the size variation of the population
- dt is the variation of time
- B is the birth (B=bN, with b = birth rate and N = population size)
- M is the death (M = mN, with m = death rate)
- r = b -m(growth rate per individual)
- C is a constant
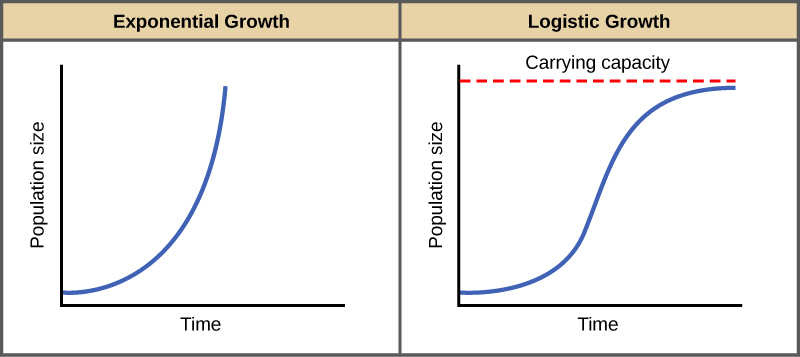
Here we can see that the growth of the population has no limit, which is is the main issue of the exponential model. In real life, the growth of a population cannot be limitless because space and resources are finite variables and because of the interaction with other species.The logistic model, presented below, tries to respond to this issue.
Logistic model
The logistic model describes the growth of a population with a limit imposed by the environment. It can be a limit caused by the lack of resources, the place.
dN/dt=r N (K-N/K)
solution : g(t) = C exp(-r t) +(1/K)
- dN is the size variation of the population
- dt is the variation of time
- r = b -m(growth rate per individual)
- B is the birth (B=bN, with b = birth rate and N = population size)
- M is the death (M = mN, with m = death rate)
Carrying capacity (K) is the maximum number of individuals of a given specie that an area’s resources can sustain indefinitely without significantly depleting or degrading those resources. So (K-N/K) is the percentage of K which admit a demographic increase.
This carrying capacity depends of the environment and is different for each specie, because something beneficial for a specie can be harmful for another one.

This model is more accurate than the previous one. But it does not take into account the interactions between different species…
We will now talk about the Lotka-Volterra equations which describes interactions between species.
Lotka Volterra equations
Here the predation equation :
dN/dt=r1*N(t)-c1*N(t)*P(t)
dP/dt=-r2*P(t)+c2*N(t)*P(t)
- dN is the the size variation of the prey population
- dP is the size variation of the predator population
- dt is the variation of time
- r1 is the prey reproduction rate
- r2 is the predator mortality rate
- c1 is the prey mortality rate
- c2 is the predator mortality rate
This equation shows two species which are codependents. In the second equation, we can see that the number of predators is higher when prey are numerous.
As an exemple, you can see the following graph that shows the evolution of two populations. Hares are the preys and Lynx the predators. The curves follow the same variations with a small delay between them. It can be explain by the fact that Lynx needs hares to eat and reproduce, whereas hares population grows when there are fewer predators. The evolution of those two populations are linked.
Notice that this picture shows a cyclic dynamic.
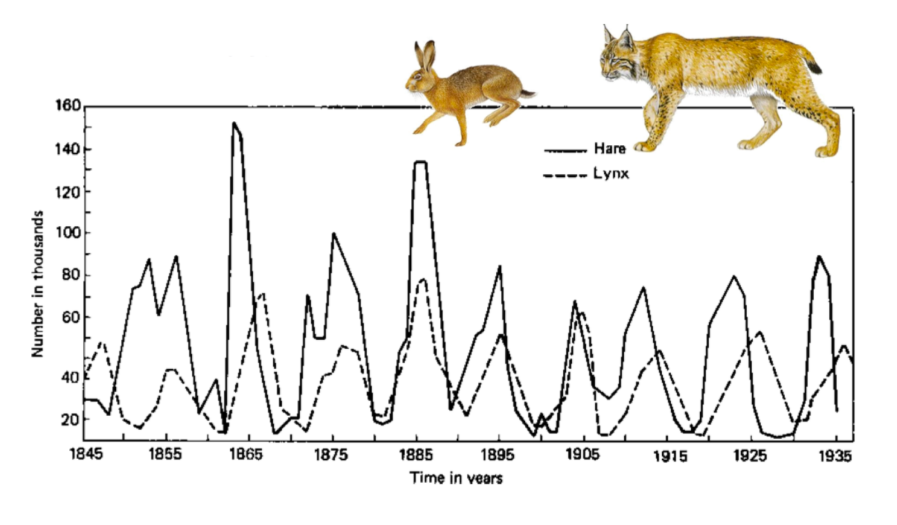
Here we are not limited by the environment so if there is no predator at all, the prey population size will grow exponentially. This can be a problem.
- competition equation :

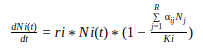
dN1(t)/dt=r1*N1(t)*((1-N1(t) +N2(t))/K1)
dN2(t)/dt=r2*N2(t)*((1-N2(t) +N1(t))/K2)
- dN1 and dN2 are respectively the size variations of population 1 and 2
- dt is a the variation of time
- r1 and r2 are the growth rate of N1 and N2
- α is the effect of N2 on N1
- β is the effect of N1 on N2
More generally :
Those effects can be inequals. It can be direct predation or competition for the same resource.
The Lotka-Volterra equations describe phenomenons, but not the mechanisms that create it. So they are good approximations but cannot really predict anything. (for example you can describe the relations between two species but not really the evolution of this relation).
B – Studies of the different dynamics (let’s speak about fixed points and schedules)
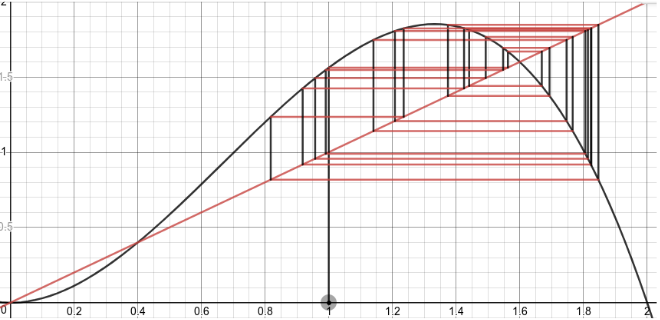
We can describe the stability of a population by studying the fixed points of the corresponding equation.
You can find those fixed points by solving f(x)=x
A fixed point can be attractive, repulsive or both. In function of the value of the fixed point you can have “simple dynamics” (a simple attractive fixed point), a cyclic dynamic (with a pattern inside) or a chaotic one (which is unpredictable).

Equation 1 corresponds to the exponential growth. equation 2 corresponds to the logistic model.
For the Lotka-Volterra model, finding the stability of the fixed points is a little bit more complicated. If you want to go further, there is a complete book about it in our references (but that’s not necessary at all. The name of the book is “Global dynamical properties of Lotka-Volterra systems.”).
You can obtain various types of fixed points which corresponds to those dynamics.
- stable dynamic (constant distribution of ages). Which corresponds to a punctual attraction
- cyclic dynamic (seasonal, annual fluctuations)
- chaotic dynamic (unpredictable variation of the population)
C – Human dynamics
Here we can speak about the impact of humans on their environment and how they react to this impact.
Like every species, humans are biological beings, we have an impact and we are impacted by our environment and interactions with other living organisms.

Human ecology is an interdisciplinary field of research that makes the link between biology and sociology. Historically, human ecology was much more based on geography because scientists wanted to link the environment and the distribution of human populations in earth.
- humans : 7,7 billions in 2018
- The largest ethnic group is the Han Chinese group
- ⅔ of the global population is in Asia
The first characteristic of Homo sapiens is that sociability is at the center of the organization of the population. It is the only solitary mammal species to reach the social complexity of social insects such as bees or colonial invertebrates such as ants.
Consequences of the overpopulation phenomenon :
- For humanity, continuous rising of population since the end of the Black Death (1350). Increase due to progress in health sciences, sanitary improvements, agriculture productivity, technologies in general). Since the population is still growing, slowing down since 1980.
- rapid depletion of non-renewable resources => induce largest population to reduce its size if dependent of those resources (example of the renewal of grass in a sheep pen if the feeding rate is bigger than growing one)
- Anthropocene
- Effet Allee “made” by human : https://fr.wikipedia.org/wiki/Effet_Allee
Lexicon
Abiotic : is an environment unsuitable for life
Abundance : total number of individuals, or the total number of individuals on a defined surface.
Biotic : Factors related to the activity of living beings and acting on the distribution of animal and plant species of a given biotope.
Ecological niche :
Emigration : leave your own place to settle down at another one.
Environment : By the term environment we will define all the abiotics and biotics compounds that compose the living area of the population studied.
Fitness : The ability of an individual to spread his genes.
Immigration : the action of coming to live permanently in a foreign country.
Iteroparity (from the latin itero, ‘to repeat’, and pario, ‘to beget’) :A species whose females can reproduce several times in their lifetime. type of reproduction strategy.
Population : In ecology, a population is a group of individuals from the same specie that live on a given geographical territory. The description of a population can be done with :
- descriptive variables (age, sex ratio, size…)
- genetic (comparison of the genetic code between individuals)
- dynamic (ratio birth/death, migration…)
Semelparity (bigbang reproduction) (from the latin semel ‘once, a single time’ and pario ‘to beget’ ): Qualifies an organism, which in its life cycle only reproduces once and then dies. type of reproduction strategy.
Conclusion and recap
Population ecology is the science that studies the dynamics of species and how they interact with their environment.
In this chapter, we learned how to characterize a population of individuals of the same specie but also how those populations can interact with their environment and how to modelize the dynamics of those populations.
A population can be characterized as time goes on (age, sex distribution through ages), by place (dispersion, abundance but also flux of emigration and immigration between different populations) and through some others factors.
Those elements can be influenced by interactions with individuals of the same population (visual, auditory or physical cues, or gene transfert between two populations) or specie, but also with individuals from another specie (numerous types of symbiosis). Some links with the environment of this population can also affect those parameters (ressources as food or nests).
Researchers can obtain informations about individuals inside a population by using some marking techniques (bird bands, amputation…) and use some estimators like the Lincoln-Petersen estimator for knowing more or less the number of individuals of a donate population.
With those informations, we can modelize the dynamics of a given population thanks to the exponential and the logistic models. They represents the evolution of the number of individuals of this population.
The Lotka-Volterra equations represents interactions between differents species (competition and predation).
But all those models are not really accurate, and cannot predict anything actually.
Sources
Introduction
Toad powerpoint Diapo sur les crapeaux en Australie
Alford, R. A. (n.d.). The Cane Toad in Australia: Invasion Biology and Control Efforts. Retrieved February 12, 2019, from https://www.ctahr.hawaii.edu/coqui/documents/RAAlfordCaneToadsAustralia.pdf
Wikipédia about populations Ecology
Wikipedia contributors. (2019a, February 8). Population (écologie) — Wikipédia. Retrieved February 12, 2019, from https://fr.wikipedia.org/wiki/Population_(%C3%A9cologie)
Definition of population ecology
Ross, J. A., International Institute for the Study of Human Reproduction. Center for Population and Family Health, & International Institute for the Study of Human Reproduction,Center For population and family health staff. (1982). International Encyclopedia of Population. Retrieved from https://www.popline.org/node/389760
Toads
Jolly, C. J., Shine, R., & Greenlees, M. J. (2015). The impact of invasive cane toads on native wildlife in southern Australia. Ecology and Evolution, 5(18), 3879–3894. https://doi.org/10.1002/ece3.1657
EusocialityWikipedia contributors. (2019c, February 10). Eusociality – Wikipedia. Retrieved February 12, 2019, from https://en.wikipedia.org/wiki/Eusociality
Part 1, why and how to characterize a population ? Powerpoint of a lesson about populations ecoly
Survival curve and age mortality tool
Pinder, J. E., Wiener, J. G., & Smith, M. H. (1978a). The Weibull Distribution: A New Method of Summarizing Survivorship Data. Ecology, 59(1), 175–179. https://doi.org/10.2307/1936645
R and K-selection
Bio.miami.edu. (2019). r and K selection. [online] Available at: http://www.bio.miami.edu/tom/courses/bil160/bil160goods/16_rKselection.html [Accessed 15 Feb. 2019].
Powerpoint of a lesson about populations ecology:
Ecologies des populations et des communautés. (n.d.). Retrieved February 12, 2019, from http://edu.ge.ch/decandolle/sites/localhost.decandolle/files/ecologie_2_population_et_communautes14.pdf
Metapopulation
Metapopulation Ecology. (n.d.). Retrieved February 12, 2019, from https://nature.berkeley.edu/beislab/rail/html/rail_metapopulation_ecology.html
Population Ecology – Metapopulations. (n.d.). Retrieved February 15, 2019, from http://www.bgu.ac.il/desert_agriculture/Popecology/PEtexts/PE-K.htm
Distribution pattern
Spatial distribution pattern. (s. d.). In Encyclopædia Britannica, Inc en ligne. From https://kids.britannica.com/students/assembly/view/108151
Verberk, Wilco C. E. P. (2011). Explaining General Patterns in Species Abundance and Distributions. the Nature Education, . Retrieved from https://www.researchgate.net/publication/260136267_Explaining_General_Patterns_in_Species_Abundance_and_Distributions
Gilad, O. (2008). Spatial Distribution Models. Encyclopedia of Ecology, 3311–3314. doi:10.1016/b978-008045405-4.00677-7
Immigration
Oxford dictionaries. (n.d.). immigration | Definition of immigration in English by Oxford Dictionaries. Retrieved February 15, 2019, from https://en.oxforddictionaries.com/definition/immigration
Lessons of Tazzio Tissot and Léa Pradier, Médecine évolutionniste
Campbell, N., Reece, J., & Heinisch, J. (2016). Campbell Biologie. Hallbergmoos: Pearson.
Part 2, relations with the environment :
- Ecological niche
Polechová, J. and Storch, D. (2008). Ecological Niche.
- Communication, Visual Cues
Penteriani, V., Mar Delgado, M., Del, Alonso-Alvarez, C., & Sergio, F. (2006, October 13). Importance of visual cues for nocturnal species: Eagle owls signal by badge brightness. Retrieved from https://academic.oup.com/beheco/article/18/1/143/209037
The Collective Set of Alleles in a Population Is Its Gene Pool. (n.d.). Retrieved from https://www.nature.com/scitable/topicpage/the-collective-set-of-alleles-in-a-6385985
- symbiosis
According to the website (https://learn.genetics.utah.edu/content/microbiome/symbiosis)
Part 3, population dynamics :
May, R. M. (1974). Biological Populations with Nonoverlapping Generations: Stable Points, Stable Cycles, and Chaos. Science, 186(4164), 645–647. doi:10.1126/science.186.4164.645
Fall, Paul Seydel (2011). Iteration, Fixed points. Online lecture, PDF.
course of Tazzio Tissot and Léa Pradier about population ecology
course of Antoine Bergel about fixed points
Takeuchi, Y. (1996). Global dynamical properties of Lotka-Volterra systems. Singapore: World scientific.
Campbell, N., Reece, J., & Heinisch, J. (2016). Campbell Biologie. Hallbergmoos: Pearson.
Explaining General Patterns in Species Abundance and Distributions | Learn Science at Scitable. (2019). Retrieved from https://www.nature.com/scitable/knowledge/library/explaining-general-patterns-in-species-abundance-and-23162842?fbclid=IwAR3crr-NR30t1jafU-pWbcpeDdwGkaXeeh3wFbLHQ84ZE0AZ0_CDk-ti2Qw (consulted the 07/02/2019)
Human dynamics
Richerson, P. J., & Boyd, R. (1997, June). The Evolution of Human Ultra-sociality [Press release]. Retrieved February 12, 2019, from http://www.des.ucdavis.edu/faculty/Richerson/ultra.pdf
Eusociality
Wikipedia contributors. (2019c, February 10). Eusociality – Wikipedia. Retrieved February 12, 2019, from https://en.wikipedia.org/wiki/Eusociality
demographics
Wikipedia contributors. (2019d, February 3). Demographics of the world – Wikipedia. Retrieved February 12, 2019, from https://en.wikipedia.org/wiki/Demographics_of_the_world
Human ecology
Zipf, G. K. (2012). Human Behavior and the Principle of Least Effort: An Introduction to Human Ecology. Retrieved from https://books.google.fr/books?hl=fr&lr=&id=m-XDCwAAQBAJ&oi=fnd&pg=PT4&dq=human+ecology&ots=Dm06kubZ1y&sig=Efn8n0cr-RWbCV26lXnmzZC97ys#v=onepage&q=human%20ecology&f=false
Duncan, O. D. (1993). Human ecology and population studies.. Readings in population research methodology. Volume 8. Environment and economy,, 5(18). Retrieved from https://www.popline.org/node/335056
Margaret M. Bubolz, M. (1970, January 1). Human Ecology Theory. Retrieved February 12, 2019, from https://link.springer.com/chapter/10.1007/978-0-387-85764-0_17
Poston, D. L. (2015). Human Ecology. International Encyclopedia of the Social & Behavioral Sciences, , 283–288. https://doi.org/10.1016/b978-0-08-097086-8.32066-9
Steiner, F. (2008). Human Ecology: Overview. Encyclopedia of Ecology, , 1898–1906. https://doi.org/10.1016/b978-008045405-4.00626-1
Wikipedia contributors. (2019e, February 8). Écologie humaine — Wikipédia. Retrieved February 12, 2019, from https://fr.wikipedia.org/wiki/%C3%89cologie_humaine
Wikipedia contributors. (2019f, February 12). Human Ecology. Retrieved February 12, 2019, from https://en.wikipedia.org/wiki/Human_ecology
part 4, lexicon :
Definition of populations ecology, interactions, evolution, spatial dynamic, speciation, relations and modelisation
UMR EcoFoG. (n.d.). Ecologie des Populations. Retrieved February 12, 2019, from https://www.ecofog.gf/spip.php?rubrique17
Itéropare, itéroparité | Glossaire DORIS. (2019). Retrieved from http://doris.ffessm.fr/Glossaire/Iteropare-iteroparite/(rOffset)/6 (consulted the 05/02/2019)
Semelpare | Glossaire DORIS. (2019). Retrieved from http://doris.ffessm.fr/Glossaire/Semelpare (consulted the 05/02/2019)
Larousse. (2010). Le petit Larousse illustré en couleurs. Paris.
pictures :
1.A.1 : Open Source
1.A.2 : Wikipedia common
1.A.3 : Open source
1.B.1 : course of Léa Pradier and Tazzio Tissot about population ecology
1.B.2 : Open source
1.C.1 : course of Léa Pradier and Tazzio Tissot, Médecine Evolutionniste
2.A.1 : Open source
2.B.1 : Open source
2.B.2 : course of Léa Pradier and Tazzio Tissot, Médecine Evolutionniste
3.A.1 : Wikimedia commons
3.A.2 : Wikimedia commons
3.A.3 : course of Léa Pradier and Tazzio Tissot, Médecine Evolutionniste
3.A.4 : course of Léa Pradier and Tazzio Tissot, Médecine Evolutionniste
3.B.1 : May, R. M. (1974). Biological Populations with Nonoverlapping Generations: Stable Points, Stable Cycles, and Chaos. Science, 186(4164), 645–647. doi:10.1126/science.186.4164.645
3.B.2 : Anouk Tomas math exercise
3.C.1 : Wikipedia commons
Circulation and gas exchange (1/4)
Introduction.
I. Diffusion and other principles underlying gases behaviors in gas exchanges.
- Gas properties
- Principles underlying gas behavior
II.From the environment to the organism and vice-versa :
- At the scale of one cell: cellular respiration
- In bigger organisms: Exchange surfaces for gas exchanges :
- Different types of exchange surfaces
- Focus on lungs
III. Circulatory system that put in relationship the exchange surfaces with cells
- General properties
- Closed circulatory system
- Open circulatory system
- Focus on double circulatory system
- Focus on the blood: role and diseases
Introduction
What does any living organism share with a candle? “What an unexpected question” you might think. Well, here is the answer: none of them survive without dioxygen. As meaningless as this can seem, this observation was the starting point of a lot more questionings and discoveries in the field of biology. Because it’s from this observation that in 1780, the French chemist Antoine Lavoisier investigates and proves that respiration is a kind of combustion. In other words, any living being, as well as any candle, consumes dioxygen in order to produce heat (that to say, energy) that’s essential to its survival, and additionally producing carbonic compounds.
Since then, a lot more research on this topic was done and today we understand gas exchanges and respiration, from the scale of a single cell to the scale of a whole organism, as the biological processes allowing for the production of energy by living beings. In this chapter, we are willing to transmit you a complete and developed overview of the knowledge on this broad topic of the biological sciences.
To begin with, the chapter will provide you with basic physical principles underlying gases behaviors that are involved in gas exchanges. Then, it will focus on explaining cellular respiration and how do gases cross the “barrier” between an organism and its environment (at the scale of one cell and then by exchanges through exchange surfaces). Finally, you will learn about the purpose and the functioning of circulatory systems, as the structures that put in relationship exchange surfaces with the rest of the body in big animals.
Circulation and gas exchange (2/4)
Introduction.
I. Diffusion and other principles underlying gases behaviors in gas exchanges.
- Gas properties
- Principles underlying gas behavior
II.From the environment to the organism and vice-versa :
- At the scale of one cell: cellular respiration
- In bigger organisms: Exchange surfaces for gas exchanges :
- Different types of exchange surfaces
- Focus on lungs
III. Circulatory system that put in relationship the exchange surfaces with cells
- General properties
- Closed circulatory system
- Open circulatory system
- Focus on double circulatory system
- Focus on the blood : role and diseases
I. Physical principles underlying gas exchanges.
To understand the physiology of gas exchanges, it is necessary to understand the basic principles underlying gas behavior. This part is meant to provide you with the prerequisites of gas physics that you will need to understand the chapter. Even though notions and principles will be explained in a general way, some sections will contain a focus on the cases of respiratory gases (O2 and CO2) and of respiratory processes, as these will be our subject for the next parts.
- What is a gas and what parameters characterize a gas ?
What is a gas ? (and basic principles)
Depending on the context, the term « gas » can either refer to a certain type of molecules (molecules of gas) (I find this definition a bit incomplete, I will refer as well that these elemental molecules are made from one type of atom (like oxygen) or compound molecules made from a variety of atoms (like carbon dioxide) or to a set of molecules that are widely spread out ( a set of molecules of gas). The first definition is more accurate when one talks about isolated gas molecules, and the second one is used when referring to a gaseous fluid.
In a gaseous fluid (a mixture of gases), each molecule has a kinetic energy that is also called heat energy.
The speed of the molecules increase with the temperature.
In a given volume, molecules occasionally meet and elastically collide with each other.
If we consider a gas enclosed in a container, the pressure of this gas refers to the measure of how often and how hard the molecules collide with the walls of the container.
What is a partial pressure ?
In a mixture of gases, each gas has a partial pressure which refers to the hypothetical pressure of the gas if it alone occupied the entire volume of the mixture at the same temperature.
The partial pressure of a gas is written : P(gas). For example, the partial pressure of the dioxygen is P(O2) and the partial pressure of the carbon dioxide is P(CO2).
Dalton’s law states that the total pressure of a mixture of gases equals the sum of the partial pressures of each gas contained in the mixture.
Here is an example of application of Dalton’s law :
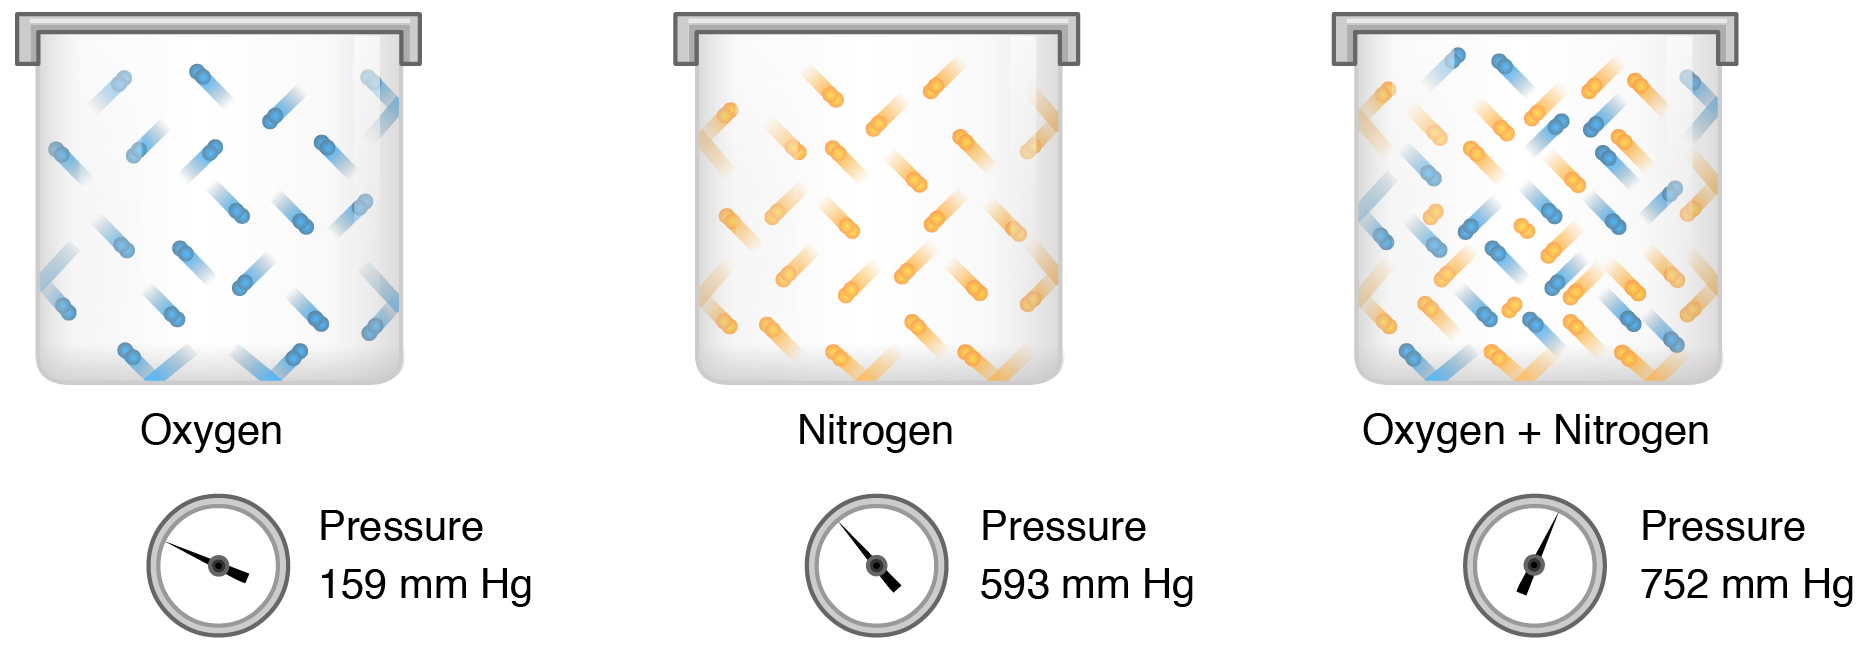
Figure 1: Dalton’s law applied to a mixture of oxygen and nitrogen.
Solubility :
The term solubility refers to the maximum quantity of solute that can be dissolved in a certain quantity of solvent or of solution. In other words, the more a solute is soluble in a solution or solvent, the easier it will dissolve inside this solution or solvent.
For gases, solubility depends on temperature and pressure.
Solubility decreases as the temperature increases. This is why water boils when we heat it : as the temperature of the water increases, the solubility of the gases in it decreases and they start evaporating. But why is it so ? The physical explanation is that, when temperature increases, the kinetic energy of the molecules increases too. And with kinetic energy, increases the motion of molecules, causing them to break intermolecular bonds and escape from the solution.
As stated before, solubility of gases is also influenced by pressure :
The process of dissolution of gases in a solution is a reaction for which an equilibrium constant can be written. For example, if we consider the dissolution of oxygen in water, the reaction is : O(g) → O(aq) and the constant of this reaction is : K = p(O2)/[O2]. This shows that the partial pressure of a gas and its concentration are directly proportional.
Solubility can be expressed by Henry’s law : Sg=kHPg with Sg the solubility of a gas, kH the Henry’s law constant and Pg the partial pressure of the gas.
2. What physical principles underlie gas behavior involving gas exchanges ?
a) Diffusion
Diffusion is the process that governs gas exchanges at the unicellular scale.
The term diffusion defines the net-movement of particles from a region to another due to a difference of concentration of the particle in these two regions that results in a concentration gradient.
Let’s deconstruct this definition and make it less harsh :
What we call a concentration gradient refers to a gradual change in the concentration of a given component between two regions of a medium. As a vector, the concentration gradient is directed from the less concentrated area towards the more concentrated area.
Fick’s Law (see equation) states that what is called the “diffusion flux” (referring to an net-movement of molecules induced by diffusion) is proportional to the negative of the concentration gradient. In other words, there is a flux of molecules along the negative of the concentration gradient so from the region that is more concentrated, toward the region that is less concentrated. This flux tends to equilibrate the distribution of the molecules in the medium, and hence their concentrations in the different regions.
J=-D∇C with J the diffusion flux, D the diffusion coefficient, and ∇C the concentration gradient
But beyond what this formula tells us, what is its physical explanation ? Why does a concentration gradient induce a flux of molecules ?
The answer is actually more mathematical than physical.
Let’s consider a medium virtually divided in two equally sized regions (see figure 2), one in which a molecule is present in high concentration and the second one in which the molecule is present in low concentration. In other words, the first region contains more molecules than the second region. As the molecules can move freely in the medium, probabilities tell us that there will be more molecules moving from the first region towards the second one than molecules moving from the second region towards the first one. So we can observe a net-movement (=overall movement) of molecules from the region that is more concentrated towards the region that is less concentrated until the concentrations in both regions equalize. From the moment that the concentrations equalize, we cannot observe any net movement anymore because if molecules are still moving freely in the medium, the number of molecules moving from one region to the other will be approximately equal to the number of molecules going in the other direction.
To summarize, the answer is that, if molecules can move freely in the medium and are present in different concentrations in different regions of the medium, there will always be more molecules flowing from the more concentrated regions to the less concentrated regions than the reverse, resulting in a net movement (flux) of molecules going in the reverse sense to the concentration gradient.
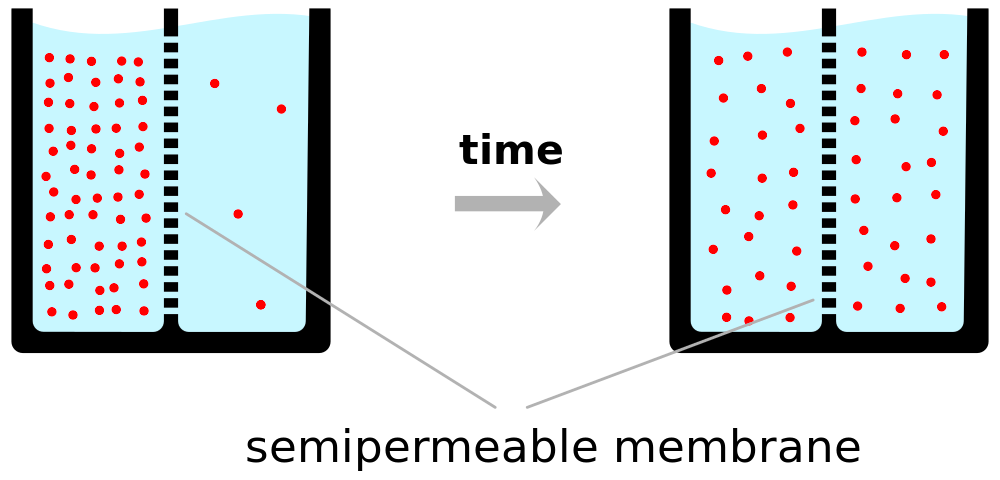
Figure 2 :Diffusion across a semipermeable membrane.
For gases, a concentration gradient is exactly the same as a partial pressure gradient.
| Be careful :It it important to distinguish between diffusion and osmotic diffusion (or osmosis). The process called osmosis (see Figure 3) is a type of diffusion in which water flows in the same sense as the concentration gradient of a molecule in order to reestablish equal concentrations of this molecule on both sides of a membrane that is impermeable to these molecules but permeable to water.
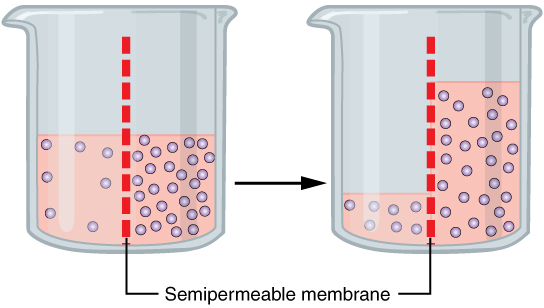 Figure 3: The process of osmosis. |
b) Gas laws and mass flow :
We can assume that biological gases behave as ideal gases. We call an ideal gas, a gas in which the individual molecules do not interact with each others. Ideal gases obey the ideal gas law :
PV=nRT with P a pressure, V a volume, n the number of molecules, R the ideal gas constant and T the temperature.
This law tells us that when the number of molecules in a mixture of gas and the temperature are constant, the product pressure times volume is constant.
Thus, for a given quantity of gas at a given temperature, the pressure and the volume of the mixture vary inversely proportionally.
For example, if we enclose atmospheric air in a container and that we compress the container in order to reduce its volume, the pressure of the air inside the container will increase.
On the contrary if we increase the volume of the container, the pressure will get lower.
This is because, by increasing the volume of the container, we would extend the space in it, which would result in the flow of the gaseous fluid down a pressure gradient, in order to fill the empty space. This flow of fluid down a pressure gradient is called « mass flow ».
Now that you have reviewed the physical principles allowing for gas exchanges, let’s switch to the next section and explore how direct gas exchanges between an organism and its environment are performed.
References for this section :
Text :
- Fan, L.S., Zhu, C., (1998), Principles of Gas-Solid Flows, New York, United States of America : Cambridge University Press
- Piiper, J., Dejours, P., Haab, P. and Rahn, H., (1971), Oncepts and basic quantities in gas exchange physiology, https://doi.org/10.1016/0034-5687(71)90034-X
- McCaulley, B., (unknown date), Gases. Retrieved from : https://brianmccauley.net/bio-6a/bio-6a-lecture/gases
- Study.com, (2018), Video : Gas exchange : Diffusion and Partial Pressure Gradient. Retrieved from : https://study.com/academy/lesson/gas-exchange-diffusion-partial-pressure-gradients.html
- Lumen Learning, (unknown date), Gas Exchange. Retrieved from : https://courses.lumenlearning.com/suny-ap2/chapter/gas-exchange/
Figures :
- Figure 1: Wikimedia. Retrieved from : https://commons.wikimedia.org/wiki/File:2318_Partial_and_Total_Pressure_of_a_Gas.jpg
- Figure 2: Wikimedia. Retrieved from : https://commons.wikimedia.org/wiki/File:Diffusion.en.svg
- Figure 3: Wikipedia. Retrieved from : https://en.wikipedia.org/wiki/Osmosis
Circulation and gas exchange (3/4)
I. Diffusion and other principles underlying gases behaviors in gas exchanges.
- Gas properties
- Principles underlying gas behavior
II.From the environment to the organism and vice-versa :
- At the scale of one cell : cellular respiration
- In bigger organisms : Exchange surfaces for gas exchanges :
- Different types of exchange surfaces
- Focus on lungs
III. Circulatory system that put in relationship the surface exchanges with cellsII. Circulatory system that put in relationship the surface exchanges with cells
- General properties
- Closed circulatory system
- Open circulatory system
- Focus on double circulatory system
- Focus on the blood : role and diseases

II. From the environment to the organism and vice-versa: diffusion of gases through exchange surfaces
In this part we want to investigate why and how do gases cross the “barrier” between an organism and its environment. In order to do so, we will first go through the explanation of gas exchanges at the scale of one cell, defining and characterizing cellular respiration and applying diffusion to the crossing of lipid bilayers by gases. Afterwards, we will focus on exchange surfaces as specialized surfaces for gas exchanges in big animals.
- Gas exchanges at the scale of one cell
a) Cellular respiration
Every living cell requires energy to survive. In order to produce this energy, it goes through the process of cellular respiration, that produces energy in the form of ATP molecules.
There are two types of respiration :
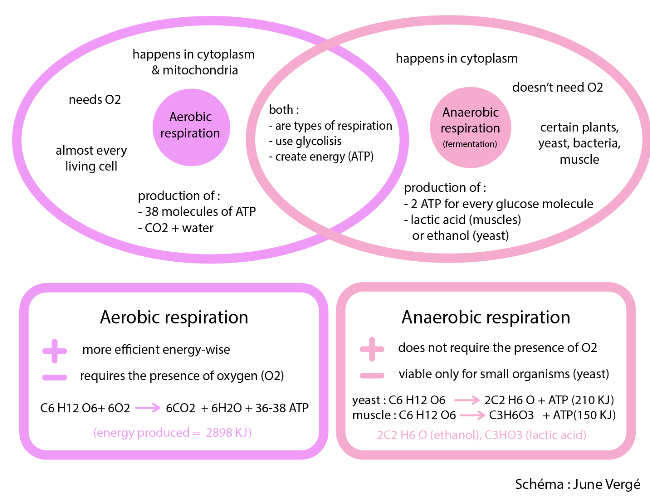 Fig 4: Aerobic and Anaerobic respiration.
Aerobic respiration is the most likely performed and the most widespread process for cellular respiration because it is way more efficient than anaerobic respiration. As it is this one that consumes O2 and releases CO2 it will be this one that we will refer to in the rest of the chapter as « cellular respiration » .
As shown in the figure, the reaction involved in aerobic respiration consists in the breakdown of glucose and 6 molecules of O2, resulting in the production of 6 molecules of CO2, 6 molecules of H2O and 36 to 38 molecules of ATP.
In other words, if we focus on gas exchanges, we can say that cellular respiration (for the rest of the chapter we will refer to cellular respiration to talk about aerobic cellular respiration) consumes dioxygen and releases carbon dioxide. These gases are hence called “respiratory gases”.
But how is O2 made available to the cell for cellular respiration? And how is CO2 evacuated from the cell after being released during cellular respiration? That to say, how does one cell exchange gases with its environment?
b) Diffusion of gases across the membrane of the cells
Respiratory gases enter or go out of a living cell by diffusion across the lipid bilayer.
Let’s look into more details the process of diffusion across a cellular membrane.
In living cells, diffusion governs the exchanges of molecules across the lipid bilayer.
Molecules flow inside the cells when their concentration is higher in the extracellular space and inversely until the system reaches thermodynamic equilibrium.
We can distinguish between facilitated and non-facilitated diffusion across the cell membrane.
Small, non-polar molecules can easily cross the membrane of the cell. Non-facilitated diffusion occurs when these molecules directly cross the membrane, through the lipid bilayer.
On the contrary, bigger, polar molecules cannot cross the non-polar lipid bilayer. So they cross the cell-membrane via special structures, made of membrane proteins, that can either allow or not allow for the passage of molecules inside or outside the cell. When molecules flow across the membrane through these structures, one says that “facilitated diffusion” occurs.
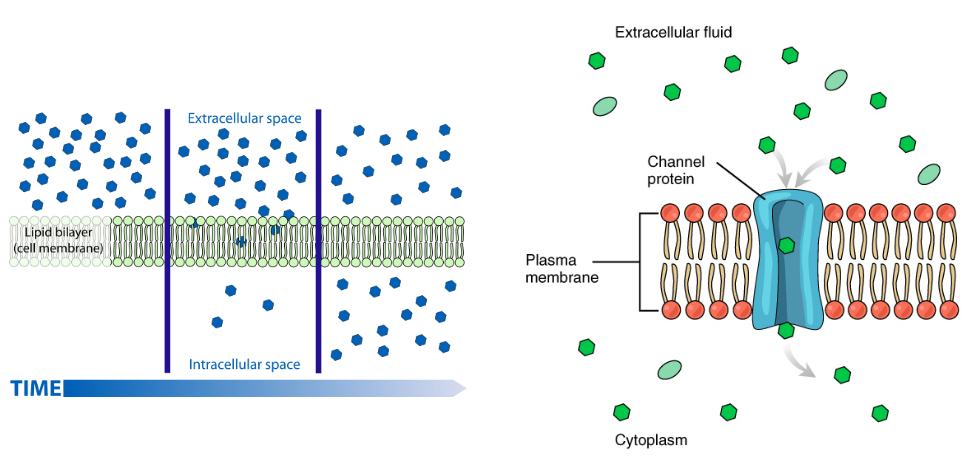
Left: Figure 5: Non facilitated diffusion across the plasma membrane.
Right: Figure 6: Facilitated diffusion across the plasma membrane
Let’s now focus on biological gases :
As they are small and non-polar, molecules of gas can flow easily across the lipid bilayer by non-facilitated diffusion. As we saw earlier, the concentration gradient for gases is the same as the partial pressure gradient. In this chapter, we will mostly mention partial pressures.
Therefore, diffusion is the direct way for gas exchanges in unicellular organisms. However, it is not the case for big, multicellular organisms that are composed of multiple types of cells, forming in multiple organs. In these organisms, direct exchanges with the environment occur in specialized tissues and organs called exchange surfaces, which will be the topic of the next part.
- Exchange surfaces for gas exchanges and ventilation
An exchange surface is a surface that sits the exchanges of matter or energy between its both sides.
In living organisms, it refers to the organs whose cells are able to exchange gases or nutrients with the exterior environment. An exchange surface is, hence, necessarily in contact with the exterior environment.
a) Exchange surfaces and respiratory systems: General principles
Respiratory systems and exchange surfaces for O2 absorption and CO2 release :
Nearly all animals benefit from surfaces that are specialized in gas exchanges.
There exist various types of exchange surfaces specialized in gas exchanges among the different animals (lungs, gills, tracheal tube, skin).
However, for all animals, these surfaces are made of cells that are in contact with the exterior environment and absorb O2 from it and release CO2 in it by diffusion. In the presence of partial pressure gradients, or more precisely when the partial pressure of oxygen in the exterior environment in higher than in the cells and when the partial pressure of CO2 is lower than in the cells, the cells are able to absorb O2 and to release O2 in the environment by diffusion.
Except for cutaneous layer, that always are in surrounded by the ambient atmosphere and, hence, cannot be running out of oxygen, all of these surfaces need to be ventilated in order for the air that’s in contact with them to be renewed. Indeed, otherwise, when the cells have absorbed the oxygen and released CO2, there would be no more partial pressure gradient and the exchanges would stop there. Thus, ventilation allows for the re-establishment of the partial pressure gradients, allowing for the perpetration of the exchanges.
b) Lungs
Lungs are the most common exchange surfaces shared by large-sized animals such as mammals, birds, and amphibians.
The lungs begin at the bottom of the trachea which is a pipe that transports air in and out from the lungs (and that starts at the mouth). Each lung has a tube called the bronchus that connects it to the trachea. The trachea and the two bronchi form an upside-down Y called the bronchial tree.
The bronchi split into smaller bronchi or smaller tubes called bronchioles that expand everywhere in the lungs. These bronchioles end up with a clutter of air sacs called alveoli, in which take place the gas exchanges by diffusion.
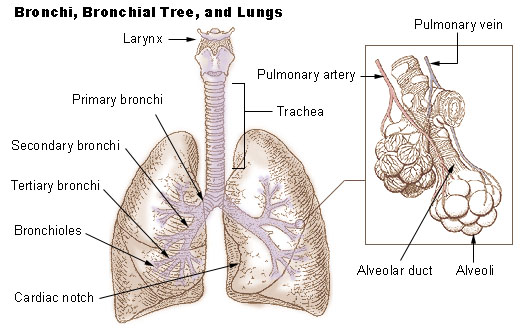
Fig 7: Basic structure of the lungs.
Ventilation of the lungs is always divided into two steps: the inhalation, during which the lungs fill with air, and the exhalation, during which the lungs release air.
However, we can distinguish between two mechanisms of inhalation/exhalation of the lungs: whereas mammals’ lungs are ventilated through negative pressure ventilation, birds’ and amphibians’ lungs are ventilated through positive pressure ventilation.
Let’s look into these two mechanisms separately.
Positive pressure: forced air movement
Positive-pressure ventilation is the type of ventilation that occurs when the animal “pushes” the air inside the lungs. It is the way for ventilation in principally amphibians and birds.
First step: the inhalation :
The buccal cavity expands. Remember, the ideal gases law states that if the volume of a mixture of gases increases, the pressure decreases. So the pressure inside the buccal cavity will decrease, resulting in a pressure gradient between the buccal cavity and the lungs and exterior environment. This gradient causes air to be drawn from the outside to inside the buccal cavity and from the lungs to the buccal cavity.
Second step: the exhalation :
Once the buccal cavity is full of air, the muscles of the respiratory system can contract and push the air that came from the lungs to the exterior and the air that came from outside to the lungs. Thus, the highly carbonated and poorly oxygenated air that came out of the lungs is evacuated whereas the highly oxygenated and poorly carbonated air that came out from the outside is drawn inside the lungs.
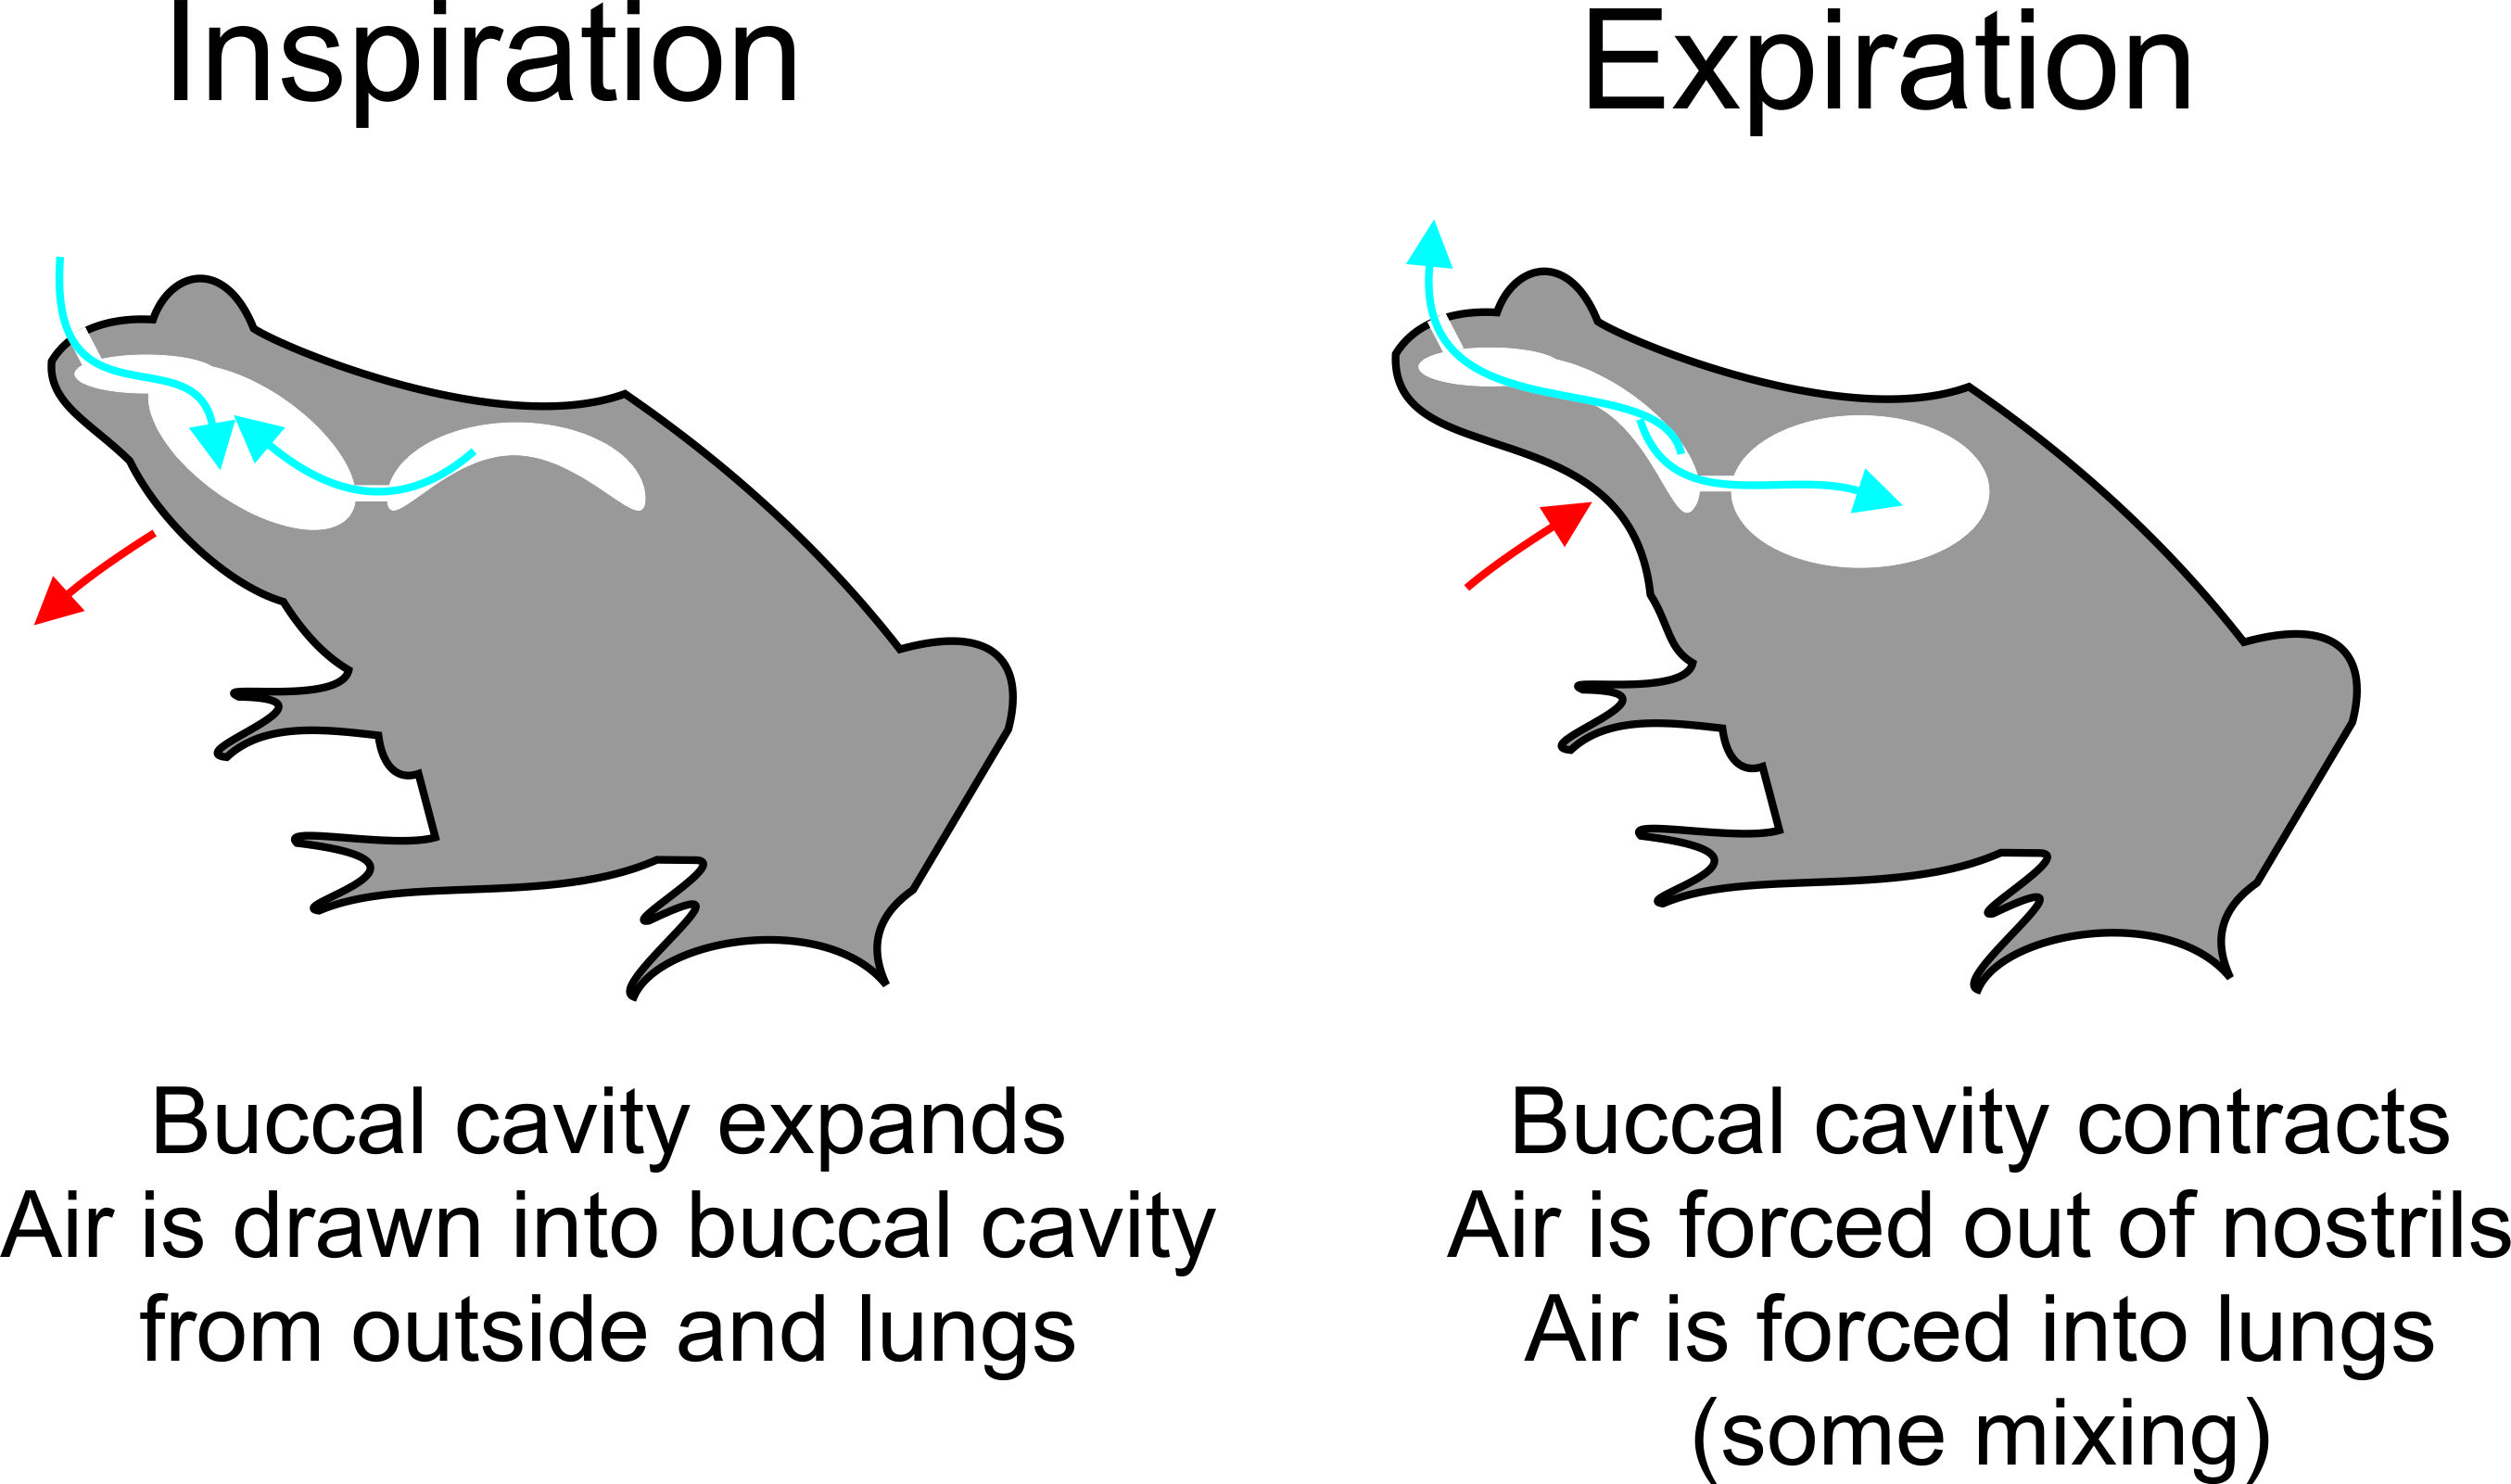
Figure 8: Ventilation of lungs with positive pressure.
Mammals: negative pressure ventilation :
The respiratory system of mammals is divided into two types of elements: the diaphragm and the intercostal muscles constitute the active system; the lungs and the thoracic cavity constitute the passive system.
For mammals, the ventilation of lungs is the result of differences between the external and the internal pressures.
First step: the inhalation :
In the first step, the inhalation, the active system deforms the passive system, resulting in a change in pressure. More precisely, respiratory muscles contract, causing the thoracic cavity to expand. This expansion induces an increase in the volume of the lungs and of the alveoli. The ideal gas law states that if the volume increases, the pressure decreases. Hence, when the volume of the lungs increases, the pressure inside them decreases, resulting in the apparition of a pressure gradient between the external air (where the pressure is higher) and the internal air (where the pressure is lower). Follows a mass flow: air flows and is drawn into the lungs until the equilibrium between the pressures is re-established, thus supplying the alveoli with air.
Second step: the exhalation :
During the exhalation, the respiratory muscles de-contract and the thoracic cavity goes back to its initial step and so do the lungs. So the volume of the lungs and of the alveoli decreases, and that induces an increase of the pressure inside the lungs, resulting in a new pressure gradient, which is in the opposite direction to the pressure gradient that appeared in the first step. This gradient causes a mass flow, still in the opposite sense to the mass flow of the first step: air flows and is drawn out of the lungs until the equilibrium is re-established, thus evacuating the poorly oxygenated and highly carbonated air coming out of the alveoli.
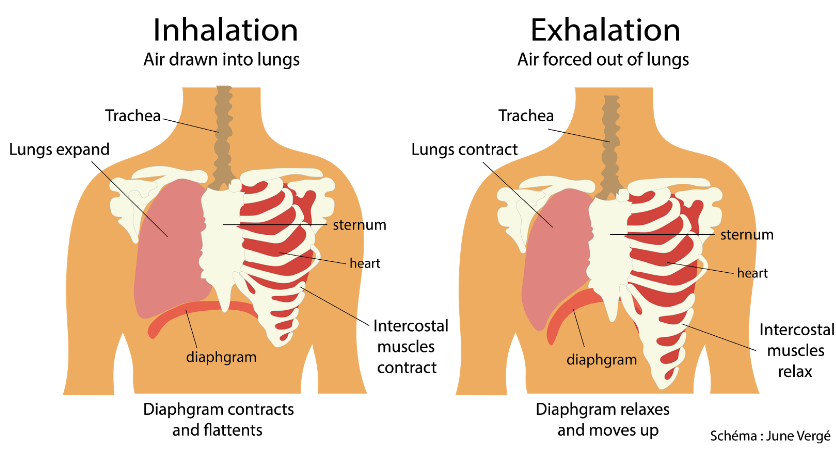
Fig 9: Inhalation and exhalation: respiratory muscles
Figure 10 : Ventilation of the lungs.
Focus on the respiratory system of humans :
In humans, the lungs are formed from the embryonic foregut.
What is the journey of the air to the alveoli ?
Air enters the body by the nostrils and is then taken into the nose where it is warmed, humidified and cleaned up by cilia that are lining the nasal cavity and filtering dust and particles contaminating the breathed air. Air can also enter the body through the mouth (however see fun fact horses). These two airways (mouth and nose) meet at the pharynx (commonly known as throat). The pharynx is a common pathway to food and air but at its bottom, the pathway divides in two, one for food (the esophagus) and one for the air. The epiglottis covers the top of this pathway when one swallows to prevent food to enter in it.
|
Fun fact : Horses are different from the other mammals in the sense that they cannot breathe through their mouth (so how do they breathe? explain… answer : well they breathe through their nose only because there are two pathways as explained above..) |
The airway starts with the larynx, also called voice-box, which is the uppermost part of the air pathway. It is a short tube that contains a pair of vocal cords that make sound by vibrating when subjected to air flow. The muscles of the larynx adjust the length and the tension of the vocal cords to adjust the pitch and the tone of the voice.
Then, the air travels through the trachea (or windpipe) that extends downward from the bottom of the larynx and reaches the lungs, where external respiration occurs.
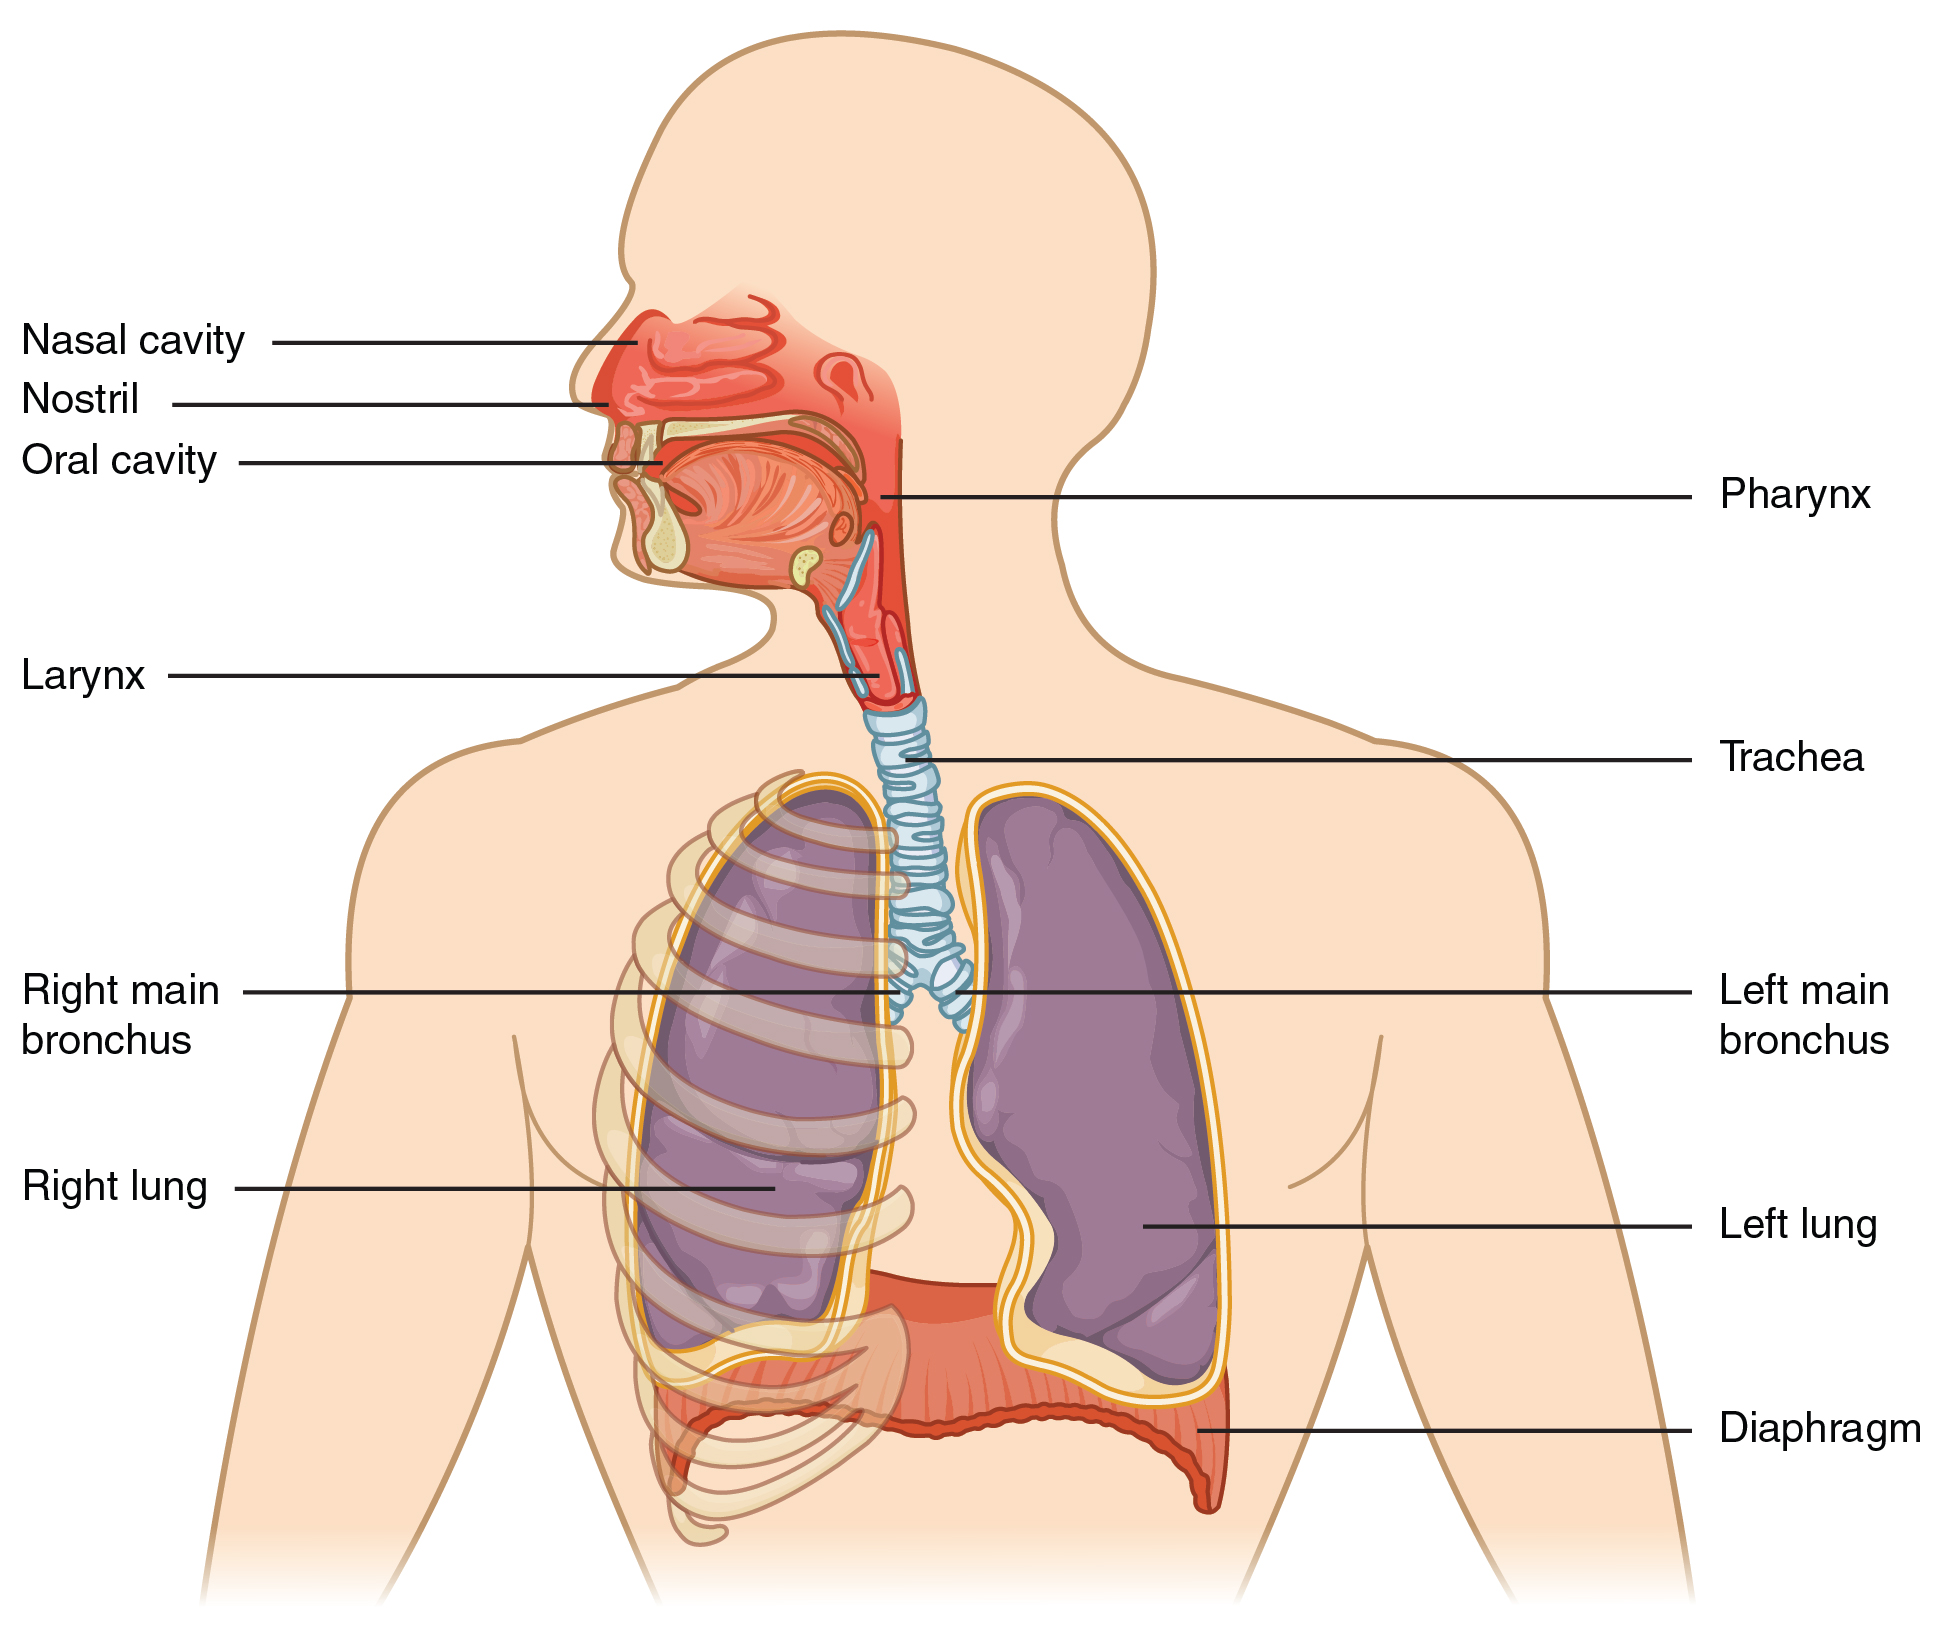
Fig 11: The respiratory system of humans.
How is ventilation controlled ?
Ventilation of the lungs is an automated process, meaning that one doesn’t have to think about breathing to breathe. Thus, ventilation needs to be controlled and regulated automatically.
Ventilation rate and intensity depend on several metabolic conditions of the body such as the pH of the blood, its pressure or its chemical composition. Changes in these metabolic conditions can be sensed by several receptors:
- Peripheral chemoreceptors are located in the arterial aortic bodies and in the carotid arteries. They can detect changes in the levels of oxygen and carbon dioxide in the blood.
- Central chemoreceptors are located in the breathing control centers of the brain (in the medulla oblongata and in the pons, two neural masses of the brain). They are sensitive to changes in the blood’s pH.
- Pulmonary mechanoreceptors are located in the lungs. They sense changes in mechanical pressure and distortion.
When these receptors sense a change, they send information to the medulla oblongata and the pons whose respiratory groups regulate the rate and the depth of respiratory muscles’ contraction in order to regulate ventilation rate and intensity.
There are four respiratory groups :
- The dorsal respiratory group, located in the medulla, controlling inhalation
- The ventral respiratory group located in the medulla, controlling exhalation
- The pneumotaxic center, located in the pons
- The apneustic center, located in the pons nucleus
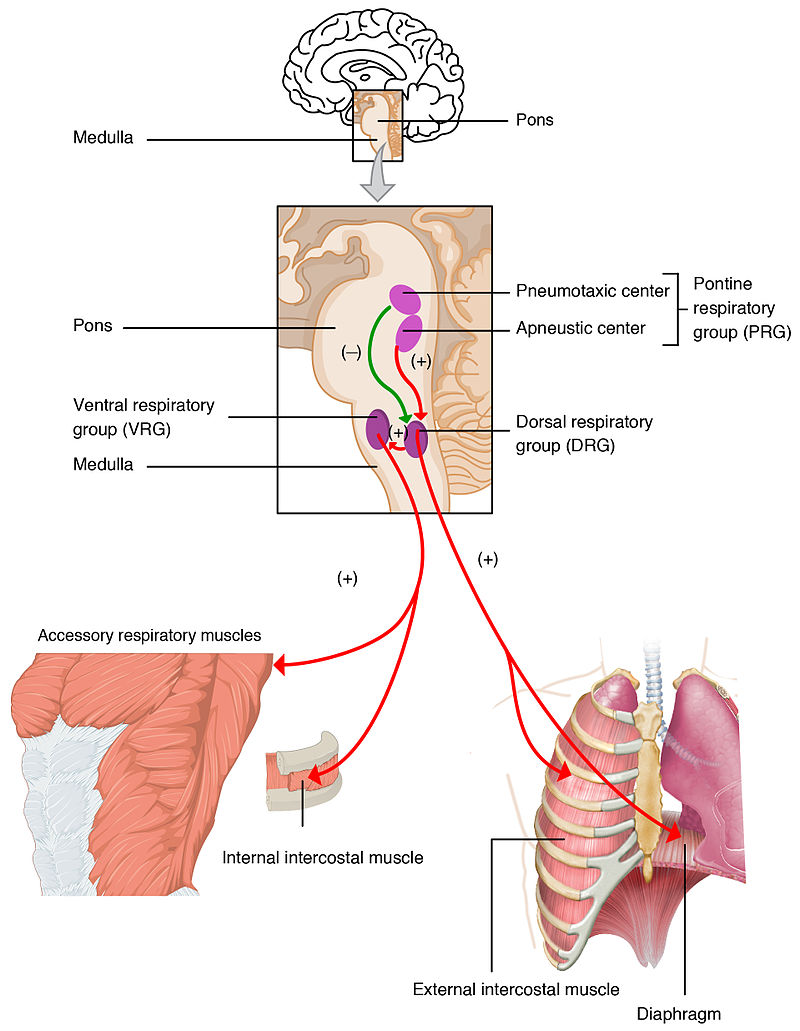
fig 12: Respiratory centers and its groups of neurons.
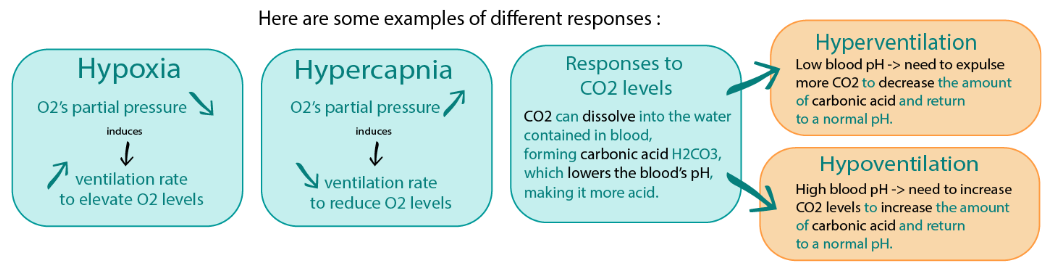
Fig 13: Examples of different responses.
c) Others
- Gills
Gills are common to fishes, shellfishes and some amphibians.
How are gills ventilated in a fish ?
When the fish opens its mouth, water flows from the mouth too and through the gills.
When water passes through the gills, O2 is absorbed by the blood in the gills filaments and CO2 is released in the water by osmotic diffusion.
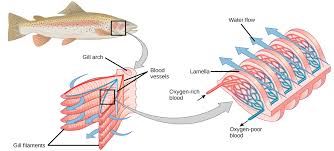
Fig 14: Structure of the fish gills
The respiratory frequency depends on the swimming speed of the fish.
- Tracheal tube
The tracheal tube is a type of respiratory system shared by insects.
Air enters the tracheal tube by the spiracles, which are breathing openings located at the surface of the exoskeleton of insects. It is then absorbed by the walls of the tracheal tube and passes to the circulatory system.
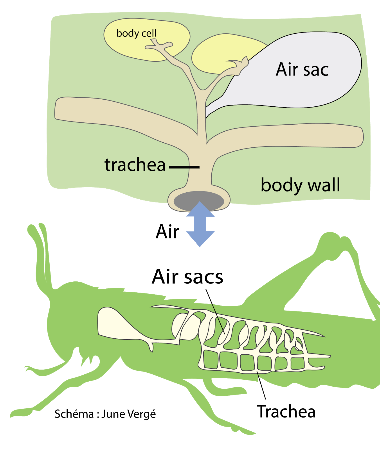 Fig 15: Tracheal tubes in a grasshopper.
Fig 16: Ventilation of tracheal tubes in a grasshopper.
- Cutaneous respiration
Cutaneous respiration refers to the absorption of oxygen and the release of CO2 by the skin. Some animals, mostly worms, breathe only through their skin. However, a lot of mammals and amphibians benefit of cutaneous respiration but not as their principal exchange surface for respiration.
As the skin is always in contact with the exterior environment, the respiration is permanent and there is no need for ventilation
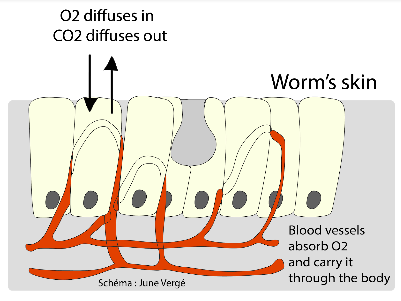
Figure 17: Cutaneous respiration in worms.
So to conclude, exchange surfaces are specialized tissues that constitute exchange sites between an organism and its environment. In the next part we will explore how gases are made available to all cells in big organisms, thanks to the circulatory system.
References for this section :
Text :
Both parts :
- Mastering Biology: Circulation and Gas Exchange
- Vergé Kemp, J., Yatim, A., Saïddi, M., Guichard, M., (2018), Gas exchanges and Circulation
- Reece, Campbell Biology 9th edition
Part 1)
- Wilson, D.F., Erecinska, M., Drown, C., Silver, I.A., (1979), The oxygen dependence of cellular energy metabolism. https://doi.org/10.1016/0003-9861(79)90375-8
Part 2)
- Bradford, A., (2018), Lungs: Facts, Functions, and Diseases. Retrieved from : https://www.livescience.com/52250-lung.html
- Unknown, (2012), Master 1 : Physio Animal – Chapitre 3 : Physiologie de la Respiration. Retrieved from : http://www.biodeug.com/master-1-physio-animale-chapitre-3-physiologie-de-la-respiration/
- Bowles, R.L., (1889). Observation of the Mammalian Pharynx, with Especial Reference to the Epiglottis. Journal of Anatomy 23(Pt 4): 606–615.
- Wagner, P.D., (2014), The physiological basis of pulmonary gas exchange : implication for clinical interpretation of arterial blood gas, ERJ Express. doi : 0.1183/09031936.00039214
- BBC, (Visited on February 12th of 2019). Respiratory system. Retrieved from : https://www.bbc.com/bitesize/guides/ztkr82p/revision/1
- Williams and al., (1996), Relationship between the humidity and temperature of inspired gas and the function of airway mucosa, Critical Care Medicine, Volume 24(11), p1920-1929.
- Guyenet, P.G., Bayliss, D.A., (2015), Neural control of breathing and CO2 homeostasis, Neuron; 87(5): 946–961, doi : 10.1016/j.neuron.2015.08.001
- Control of ventilation (s. d.). in Wikipedia, the free encyclopedia. Retrived in January of 2019 at https://en.wikipedia.org/wiki/Control_of_ventilation
- Iftikhar, N., (2018), Breathtaking Lungs : their function and anatomy. Retrieved on : https://www.healthline.com/human-body-maps/lung#lung-anatomy
- Fitzgerald, L.R., (1957), Cutaneous respiration in man. Physiological reviews, volume 37(3). https://doi.org/10.1152/physrev.1957.37.3.325
Figures :
- Intro gif: Giphy. Retrieved from : https://giphy.com/gifs/oxygen-10biAakhEisyVG
- Fig 4: Scheme by June Vergé Kemp
-
Left: Figure 5 : Wikipedia. Retrieved from : https://en.wikipedia.org/wiki/Passive_transport
-
Right: Figure 6:Wikimedia. Retrieved from : https://commons.wikimedia.org/wiki/File:0306_Facilitated_Diffusion_Channel_Protein.jpg
- Fig 7: Wikimedia. Retrieved from :

- Figure 8: Wikimedia. Retrieved from : https://en.wikipedia.org/wiki/Buccal_pumping
- Fig 9: Scheme by June Vergé Kemp
- Fig 10: Giphy. Retrieved from : https://giphy.com/gifs/AOUxD8wFVArOE
- Fig 11 : Wikimedia. Retrieved from : https://commons.wikimedia.org/wiki/File:2301_Major_Respiratory_Organs.jpg
- Fig 12: Wikimedia. Retrieved from : https://commons.wikimedia.org/wiki/File:2327_Respiratory_Centers_of_the_Brain.jpg
- Fig 13: Scheme by June Vergé Kemp
- Fig 14: Wikimedia. Retrieved from https://commons.wikimedia.org/wiki/File:Figure_39_01_04.jpg
- Fig 15: Scheme by June Vergé Kemp
- Fig 16: Giphy. Retrieved from : https://giphy.com/gifs/breathing-lutz-LBxf1npnVmOTC
- Figure 17: Scheme by June Vergé Kemp
Circulation and gas exchange (4/4)
Plan :
I. Diffusion and other principles underlying gases behaviors in gas exchanges.
- Gas properties
- Principles underlying gas behavior
II.From the environment to the organism and vice-versa :
- At the scale of one cell : cellular respiration
- In bigger organisms : Exchange surfaces for gas exchanges :
- Different types of exchange surfaces
- Focus on lungs
III. Circulatory system that put in relationship the surface exchanges with cells
- General properties
- Closed circulatory system
- Open circulatory system
- Focus on double circulatory system
- Focus on the blood : role and diseases
III. Circulatory systems: put in relationship the exchange surfaces with the cells.
We have seen in the second section that living organisms exchange gas with their environment by diffusion. In unicellular (like bacterias) or small organisms having large enough exchange surfaces (f.e.: flat worms) diffusion is efficient enough to diffuse gases in the whole organism and make it available for all of the cells.
In bigger animals, however, diffusion is not efficient enough to distribute gases in all of the cells. This is why, during the course of evolution appeared different forms of circulatory systems (or vascular system), adaptive structures that perform the transportation of gases and other elements in an organism to make them available to all cells.
The circulatory system is a circuit that puts in relationship the exchange surfaces of an organism with all of its cells
- Circulatory systems: General properties
Vascular systems consist of three elements : a vasculary liquid (the blood, or a blood-like liquid), one or several pump(s) (heart) and vessels.
The roles of the body liquid are (see more details in part III.5) :
- To carry nutrients
- To carry hormones
- To carry respiratory gases
- To help in fighting diseases
- Maintain body conditions (temperature, pH,…)
The role of the pump(s) is to propulse the liquid into the vessels by contracting and exerting a pressure on it.
There are two types of vascular systems: closed and opened one.
Let’s look into these separately
2. Open circulatory system
The open circulatory system is characterized by the fact that the vasculary liquid is in direct contact with the other tissues of the organism. It is hence mixed with the interstitial liquid (the liquid that bathes the cells of the body). This liquid is a blood-like liquid called hemolymph.
The open circulatory system is mostly found in arthropods and mollusks.
It is composed of one or several pump(s) and of arteries. There is no veins or capillaries. Exchanges between the tissues and the hemolymph occur in a cavity called hemocoel, in which the hemolymph is pushed when the pump(s) contract(s).
Open circulatory systems have their advantages. Indeed, as the pressure exerted by the pump(s) on hemolymph does not need to be high, this gives to the open circulatory system low energy cost.
Roles and mechanisms of the open circulatory system:
- Tissue oxygenation/(gas exchange) (sometimes)
Hemolymph contains a respiratory pigment (a protein) called hemocyanin which can eventually fix oxygen to transport gases. This is hemocyanin that gives hemolymph a blue-green color when it is oxygenated. The oxygen is caught by copper ions present in hemolymph. Hemolymph appears grey when it is deoxygenated.
- Nutrition:
Hemolymph contains proteins and sugars that are transported throughout the circulatory system
- Immune protection:
Hemolymph also contains cells called hemocytes. These are the equivalents in invertebrates of phagocytes (see the part on blood (section III, part 5) and the chapter on the Immune system)
Hemolymph circulation mechanism:
Heart or hearts contract and pulse(s) hemolymph in the hemocoel. When the heart(s) relaxe(s), blood comes back by pores that are in every heart. When the heart contracts the pores close thanks to their valves.
Arthropods and most of mollusks have an opened circulatory system with one or several heart(s) composed of only one chamber.
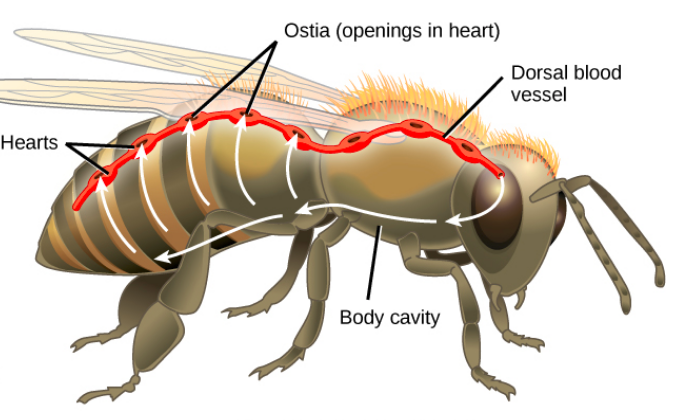
Figure 18: Bee’s organ systems. Circulatory system is in red.
3. Closed circulatory system: simple vs double
This circulation is considered more evolved because as the blood pressure is higher, the blood can go further and faster and organisms’ metabolism can be higher, so they can move, digest and excrete waste faster. For example, big types of Mollusks (squid and octopus) have closed circulatory system, whereas small ones have opened system, as we have seen earlier.
The closed circulatory system performs the same functions as the open one but additionally transports respiratory gases (in all cases, in opposition with the open circulatory which rarely transports gases).
As the system’s name says, the circulatory liquid, here called blood, does not leave vessels and, in normal situation, is never in direct contact with the rest of the organism. The blood is separated from the interstitial liquid.
The heart (the pump) pulses the blood in big vessels arteries, then it goes to vessels of smaller and smaller diameter (arterioles). When the blood comes to capillaries (microcirculation units), the gas exchange occurs (see the mechanism here later). The gas exchange is between the blood and interstitial liquid or between the blood and the cells of the respiratory system, depending on capillaries that are considered. Once in the interstitial liquid, the gas goes to the cells by simple diffusion (explained earlier). Finally, blood goes to vessels of bigger and bigger diameter to the heart (venules and veins). Pay attention, the name of the vessel does not depend on the composition of blood that goes in it. The name of the vessel depends only on blood flow direction, whether it goes away or towards the heart (veins go towards the heart and arteries go away from the heart).
The heart of vertebrates is a muscle, composed of two or more chambers: those whose role is to retrieve the blood, atrium(s) and those whose role is to send the blood, ventricle(s).
- Simple circulation
This type of circulation is characterized by its only circuit.
The heart is composed of two chambers: one atrium and one ventricle. The blood that enters and goes out of the heart is deoxygenated (poor in oxygen). The blood that goes out from the heart (through the ventricle), goes through the first capillary system (at the gills) where blood is oxygenated and then goes to the second capillary system (the organs and tissues) to distribute the gas, without passing through the heart in between.
This type of closed system is present notably in fish and worms.
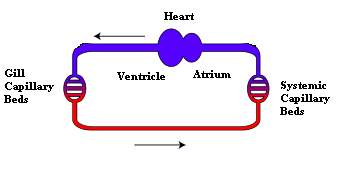
Fig 19: Simple circulatory system in fish.
- Double circulation
The double circulatory system is characteristic of Amphibians, Mammals, and Reptiles.
It is characterized by the simple fact that the blood will pass twice through the heart before finally returning to the initial point in the circulation of the bloodstream.
The circulation is divided into two circulations: the pulmonary circulation called the small circulation via which the blood gets oxygenated by the lungs and the systemic circulation called the big circulation, via which the blood oxygenates all organs of the organism.
Amphibians, Mammals, and Reptiles present slight differences between their circulatory systems. In the next section, we will focus on the mammals’ circulatory system.
| Fun fact: Comparative anatomy of mammals:The bigger an animal is, the slower his heart beats. Approximately all animals’ heart has the same limit of the number of heartbeats during lifetime is the same: 1billion times. But thanks to our lifestyle improvement, human’s heart limits have been pushed beyond 2 billion. |
4. Double Circulatory system of Mammals
a) Circuits
The circulatory system of mammals is composed of two circuits, and one pump made up of two sub-divisions : the left and the right heart, each of them containing one atrium and one ventricle.
General circulation is the name given to the combination of the two circuits: systemic circulation (large circulation) and the pulmonary circulation (small circulation).

Figure 20: overview of the double circulatory system.
- Pulmonary circulation
The first circulation is called the pulmonary circulation. It carries deoxygenated blood from the right heart towards the lungs where gas exchanges take place and then, returns the oxygenated blood to the left heart.
Deoxygenated blood is transported from the right heart, directly to the lungs through the pulmonary arteries. Once it’s pushed out of the right heart, the blood flows into the pulmonary trunk which then divides into the right pulmonary artery and the left pulmonary artery. Then, the blood flows in these two arteries, and it’s respectively led to the two lungs. Which then, divided into several and thin alveolar capillaries where take place the gas exchanges between the alveoli and the circulatory system, by the diffusion phenomena. When they pass from the alveoli to the blood vessels, gases have to cross the simple squamous epithelium layer (see more in Chapter about animal and form function).
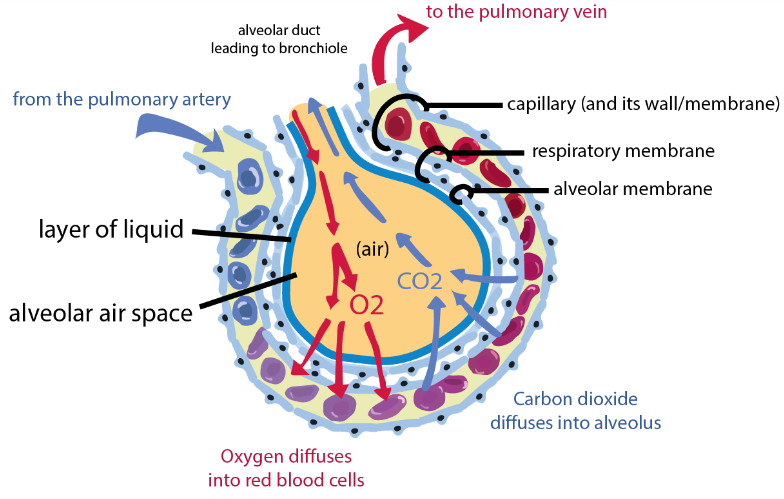
Fig 21: Gas exchange with circulation at the alveoli level.
Finally, the newly oxygenated blood is then transported through the pulmonary veins back to the heart to the left heart.
| Comparative study: Reptiles, amphibians and mammals do not only exchange gases via their lungs: as we saw earlier, cutaneous respiration is another way for gas exchange in amphibians and mammals. Hence, their pulmonary circulation can also be referred to as pulmonary cutaneous respiration because the capillaries, in which gas exchanges with the environment occur, are not located only in the pulmonary alveoli but also in the skin. |
Like amphibians, mammals also have pulmocutaneous circulation.
- Systemic circulation
The second circulation is called systemic circulation. It carries oxygenated blood through the systemic arteries from the left heart to the tissues/muscles where gas exchanges with the rest of the body take place and then return the deoxygenated blood to the right ventricle. That, passing through the systemic veins.
When pushed out of the left heart, the blood flows into the vein aorta. This vein then splits into smaller vessels and these smaller vessels into thinner capillaries. These capillaries are in contact with the interstitial liquid with which occur gas exchanges, by diffusion. The capillaries then join together, forming bigger vessels and veins where is carried the newly de-oxygenated blood, which then joins again to form the vena cava. The blood flows through the vena cava to the right atrium and ends up in the right ventricle.
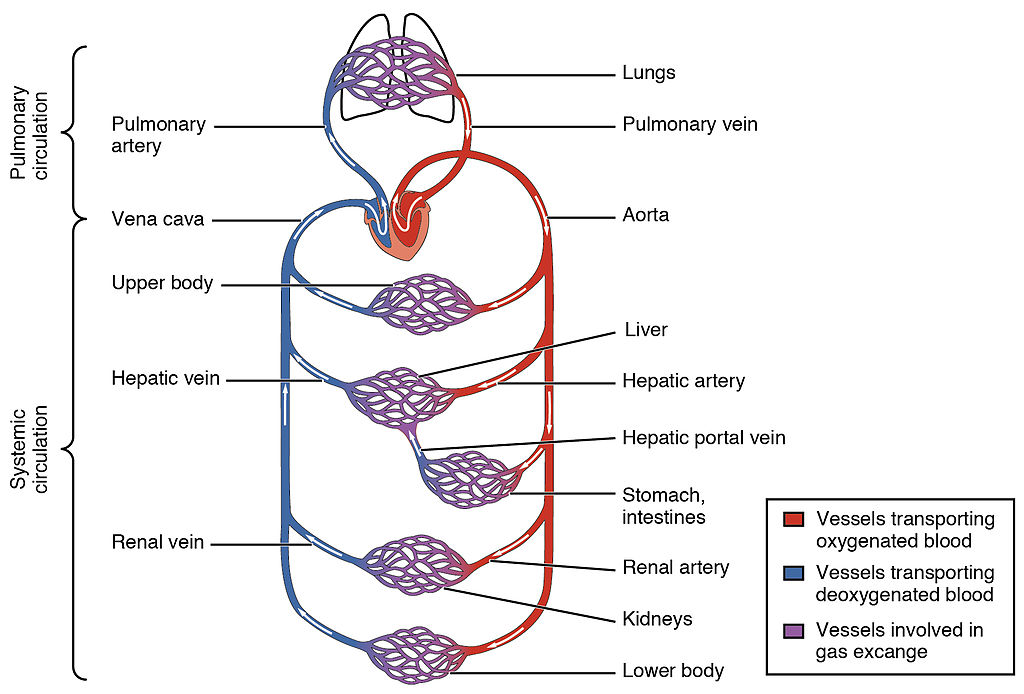
Figure 22: Systemic and pulmonary circulation.
Double circulation is required for land vertebrates otherwise the large decrease in blood pressure as blood moves through the lungs would prevent efficient circulation through the rest of the body.
The pulmonary circulation is the lower-pressure circuit to the lungs whereas the systemic circulation is the higher-pressure circuit to the rest of the body.
b) Let’s focus on the functioning of the heart :
Fun fact: the human heart is about the size of a closed fist.
The human heart is located in the thoracic region, behind the sternum.
Fig 20: the position of the human heart Wikimedia commons File: Heart near.png
As you saw earlier, the heart of mammals is divided into 2 pumps, the right heart and the left heart separated by a tissue called the septum. These pumps are symmetric, even though the left heart is slightly bigger than the right heart.
Each of these two pumps is composed of two cavities (or chambers), one atrium and one ventricle, that are separated by the valves. The atria contract in order to push the blood into the ventricles.
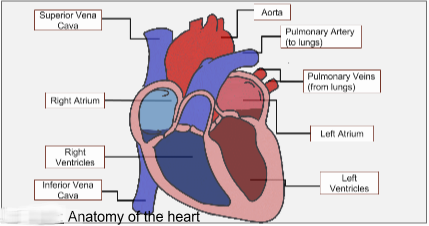
Figure 23: Structure of the heart.
| Comparative anatomy: Amphibians hearts have only three chambers instead of four. |
Cardiac revolution :
The blood circulation takes place initially in the heart thanks to two muscular phenomena which take place in it: the muscles contraction called the systole and the relaxation phase called the diastole.
We can distinguish between ventricular and atrial diastole/systole. Both ventricles and atria are involved in the cardiac cycle. But their diastole/systole cycle is not synchronized during the cardiac cycle. Here is an overview of it :
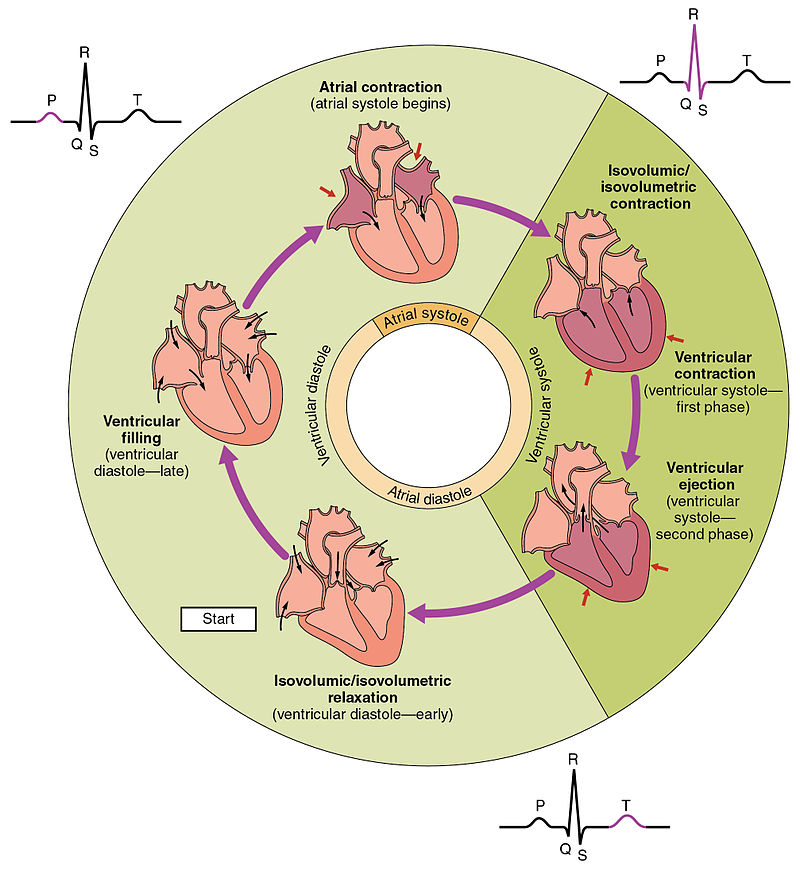
Figure 24 : the cycle of cardiac revolution.
Overall, we can divide this cycle into three phases :
The cardiac revolution is composed of 3 distinct moments:
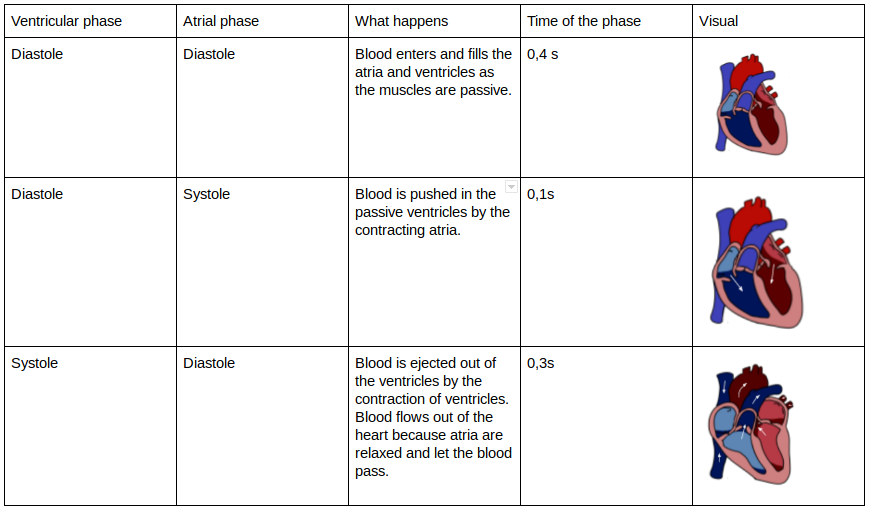
Figure 25: Sum up of the cardiac revolution cycle.
Just as it takes a pump to confine the wheels of his bike, the heart uses its own pump to circulate the blood. The contraction of the right ventricle pumps the blood to the lungs through the pulmonary trunk. This one divides into two left and right pulmonary arteries, each branching into the corresponding lung.
The blood then flows along the capillaries of the right and left lungs.
As we know, subsequently, the blood captures O2 and releases CO2.
The O2-enriched blood returns from the lungs, passing through the right and left pulmonary veins to join the left atrium of the heart. Then, the O2-rich blood is spread in the left ventricle of the heart.
The ventricle opens and the left atrium contracts. The left ventricle releases O2-rich blood to different body tissues through the systemic circulation.
The blood then leaves the left ventricle through the aorta. This one will carry blood to the other arteries that are present all along the body. It is the coronary arteries that provide the necessary blood to the heart muscle. Then the following branches of the aorta open on the capillaries of the upper body (head and arms). The aorta then descends to the bottom of the body. Venules are the junction of several capillaries that allow the blood to flow into the veins. O2-depleted blood from the head, neck, and forelimbs is concentrated in a large vein who’s called the superior vena cava. It is interesting to know that the inferior vena cava collects blood from the trunk and hind limbs. The two cellar veins pour their blood into the right atrium, from which the O2-poor blood travels into the right ventricle before returning to the lungs.
c) Blood vessels and arterial pressure
We have already seen earlier, that there are three general types of vessels. In this part, we are going to see more precisely their structure, in order to understand the blood pressure, the blood flow and the process of gas exchange. Indeed, these phenomenons and vessel structure are closely linked.
To begin with, all types of vessels are covered by a layer of epithelial vessels, called endothelium. As far as capillaries are concerned, they have only basal lamina, in addition to the endothelium. This makes capillary walls thin so the exchanges between the blood and the interstitial liquid can occur easily.
Arteries and veins are more complex. They have two more types of layers: smooth muscle and elastic tissue. In fact, as the endothelium layer is very smooth, it helps to decrease the resistance that comes from frictions between the blood and the inside of the vessels. The muscle layer plays different roles in arteries and in veins. In arteries, it serves for the blood pressure regulation, that will be described later. In veins, this layer helps the blood return to the heart by rhythmic contractions. Nevertheless, the blood return happens mostly thanks to the contractions of skeletal muscles surrounding the vessels. By the way, veins are provided with valves, that permits the blood to move only in one direction.
Finally, the elastic tissue helps the vessel to stretch and to undergo the big pressure exerted by the heart. Because of the difference of pressure, veins’ walls are three times thinner than arteries’ ones, because veins are just bringing the blood (at low pressure) back to the heart.
| Fun fact: The largest vessel in the human body is aorta (the first artery of systemic circulation). In fact, it is 5 cm², and so approximately 2,5 cm of diameter! |
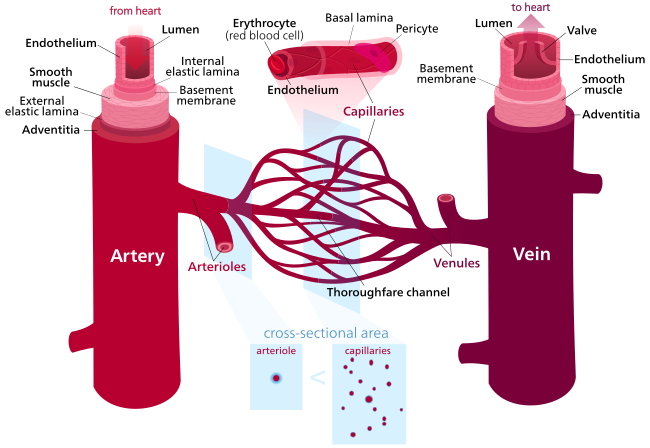
Figure 26: The structure of blood vessels.
Now that we have seen the vessel structure, we are going to learn about the blood flow in the large (systemic) circulation.
There are several parameters, concerning the blood flow, that we are going to see: blood speed, exchange surface area, and pressure. All of these parameters evolve depending on the vessels, in a way to facilitate gas exchange at the capillaries and faster transport in the other vessels.
Here is an graphical overview of the variation of these parameters depending on the vessels :

Figure 27.a : Systemic circulation parameters.

Figure 27.b : Systemic blood pressure.
First of all, as we can see on the first graph above, the exchange surface area (cross-sectional area) increases as the diameter of the vessels decreases. Thus, the surface area is the largest in capillaries, which favorizes gas exchanges through the walls of the capillaries.
Let’s now look at the speed graph. We observe, at first sight, a paradox: the blood goes slower in capillaries (small diameter) than in arterioles and arteries (bigger diameter). We normally expect that liquid will flow faster when it enters a tube with a smaller diameter… This happens when the tube is continuous and without ramifications. It’s not the case when it comes to capillaries. Indeed, there are so many ramifications, that the speed decreases because of frictions. This phenomenon is important for the exchange: when the blood goes slower, there is more time for diffusion to occur. Then, the flow speed increases regardless of bigger diameter of venules, because their total surface is smaller enough.
Let’s now look at the pressure evolution from arteries to capillaries and then to veins. First of all, what is blood pressure? It’s a pressure that the blood exerts on the vessel walls from the inside. You can feel its variation when you touch your wrist to measure your pulse. You feel how the arteries stretch (in diameter) thanks to the elastic tissue and turn back to their normal state. That is what we actually observe in arteries, at the beginning of the pressure graph. The variation is due to the alternation of the heart’s contraction (systole) and relaxation (diastole). This variation of pressure gives two parameters in measuring the arterial blood pressure: systolic pressure and diastolic pressure.
Then the blood pressure goes down in capillaries. This is due to important frictions with all walls of numerous capillaries’ walls and finally, it continues to drop in veins.
Pressure regulation
Even if the heart seems to be the only organ in establishing the blood pressure, keep in mind that vessels are crucial in pressure regulation. In fact, arteries can tighten (vasoconstriction) and dilate (vasodilation) in response to nervous signals or chemicals present in the blood. This can be possible thanks to the smooth muscle layer present in arteries’ walls. Example: after vasoconstriction of arterioles, the volume in arteries increases and so the pressure increases too.
Be careful, what will really regulate the vessels diameter are molecules synthesized by the vessel itself. Signals that are received, are here only to trigger the synthesis of these molecules. The heart contributes to adequate regulation as well. For example, after vasodilation the pressure drops, the heart then pumps the blood faster.
Focus on capillaries
Now let’s talk about capillaries. Until now we have seen that their structure is very simple and that they are an important element of the circulatory system because they form the exchange surface. This description makes the impression that they are static, but this is far from being static! It is true that capillaries cannot tighten or dilate because they don’t have any smooth muscle layer, but there are precapillary sphincters situated at the entrance of each capillary. These sphincters are made of smooth muscles that contract when the organ irrigation by the capillaries does not has to be important. For example, muscles don’t need to be fully irrigated at rest. This way only 5 to 10% of all capillaries of the body are irrigated simultaneously!
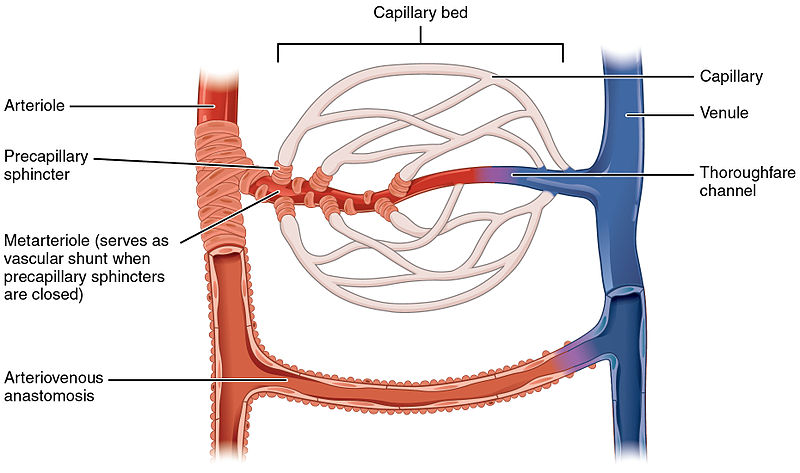
Figure 28: Capillary bed
| Fun fact: Your mood (precisely serotonin levels) is connected with the blood pressure. |
- Blood, its role and diseases
a)composition and properties of blood :
Blood is a connective tissue (see the chapter about animals form and functions) specialized in transport.
Blood is the body fluid that flows into the circulatory vessels of vertebrates. It is composed of different type of blood cells that are suspended in blood plasma.
Blood cells include :
- Red blood cells (or erythrocytes),
They are the most abundant cells contained in blood, indeed, they constitute 45% of the blood volume.
Their structure and metabolism are such that they can carry oxygen :
–> Their diameter is of 7-8microm and they are thicker on the borders and thinner in the center. This structure allows them to increase their contact surface with the exterior which favorises oxygen fixation.
–> They lack nucleus and mitochondria and they have an anaerobic metabolism to prevent them from consuming the oxygen they carry.
- White blood cells (or leukocytes) that are involved in immunity and make up less than 1% of the blood volume. (See chapter on immunity)
- Platelets, involved in blood clotting that make up less than 1% of the blood volume.
The blood plasma is composed of 90% water. It is also composed of electrolytes (dissolved ions), proteins, gases (O2 and CO2) and nutrients. The blood plasma helps maintain the pH of the blood and the temperature of the body. It constitutes about 54 % of the total volume of the blood.
In most vertebrates, the blood’s pH is regulated to remain between 7,3 and 7,5.
The acid/base couple CO2/HCO3- contained in the blood acts as a buffer.
Thus, the value of the blood pH is defined by : pH = 6.2 + log ([HCO3–]/[CO2(g)]) .
Lungs regulate the concentration of CO2 and kidneys regulate the concentration of HCO3-, thus regulating the value of the pH.
However, tissues can experience different pH depending on their types: exercising tissues experience acidic conditions because they have a high rate of respiration so a high rate of CO2.
b) how does the blood carry respiratory gases ?
We have seen in the previous parts that gases are transported in the blood to be distributed to every cell of the organism via the circulatory system.
But how does blood carry O2 and CO2 exactly? The mode of transportation of these two molecules are actually different, so let’s examine them separately.
O2 is carried in arterial blood. Molecules can form a reversible binding with respiratory pigments such as hemoglobin that are present in red blood cells. This way, they fix to red blood cells that lead them around the circulatory system, driven by the blood flow.
Hemoglobin is a protein made of 4 symmetrical subunits (two alpha subunits and two beta subunits). Each of these subunits surrounds a heme, which is a cofactor including an atom of iron on which one molecule of O2 can bind. Thus, the hemoglobin can bind to a maximum of four molecules of dioxygen.
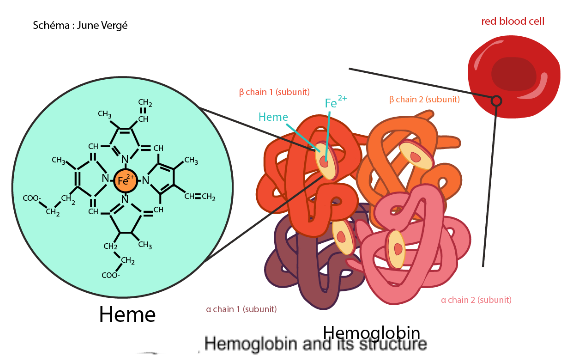
Fig 29: Hemoglobin and its structure.
Hemoglobin changes its conformation as O2 binds.
When the first O2 binds to the hemoglobin, the three remaining subunits of the protein change shape slightly, increasing their affinity for oxygen. Indeed, as soon as oxygen molecules start binding to the hemoglobin, it switches to R conformation, a conformation in which polypeptide chains become weaker and the heme hence have a bigger affinity for oxygen?
On the contrary, when four oxygen molecules are bound and one subunit releases its oxygen, the other three change shape again which causes them to release their oxygen more readily. Indeed, as soon as oxygen molecules start being released, the hemoglobin switches to T conformation, a conformation in which the polypeptides chains are stronger and hemes have a lower affinity for oxygen.
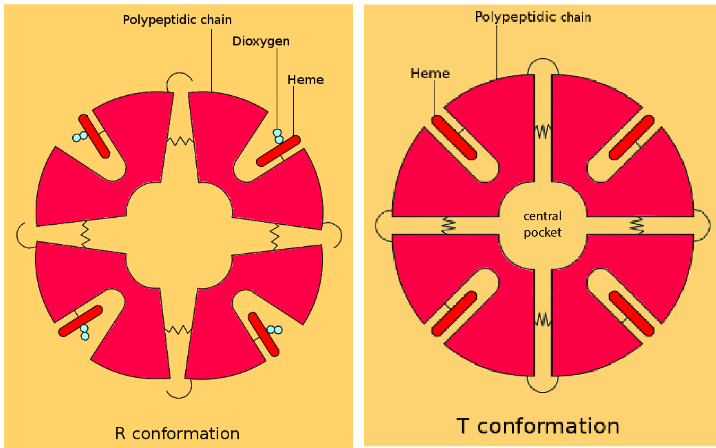
Fig 30: Hemoglobin in R and in T conformation.
It is also worth pointing out that more oxygens bind to the hemoglobin as the partial pressure in the blood increases.
The binding of oxygen with hemoglobin increases drastically its solubility in the blood, allowing for the transport of significantly bigger quantities of oxygen.
This is why only about 1.5 percent of the oxygen is carried by the blood flows freely in the plasma, while the other 98.5 percents are fixed on red blood cells.
The oxygen carrying capacity of hemoglobin (that determines the quantity of O2 that’s transported in the blood via fixation to red blood cells) is affected by several factors : the pH (therefore, the carbon dioxide level – cf part on transportation of carbon), and the temperature, as these factors influence the conformation of proteins (a change in the conformation of a protein inducing a change in its function or preventing the protein to operate its functions is called denaturation).
The information is summarized in the following figure :
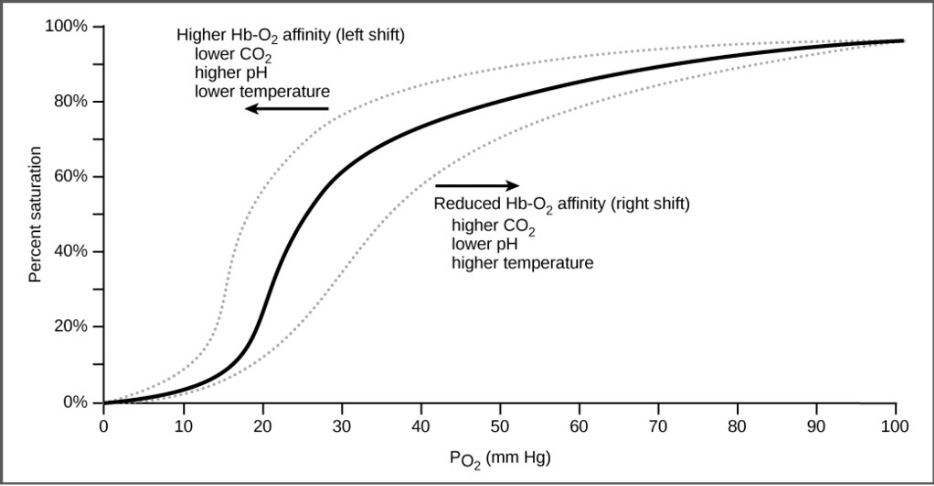 Figure 31: Hemoglobin dissociation curve
The curves you can see on this graph are called “hemoglobin dissociation curves”. They represent the percentage of saturation of hemoglobins depending on the P(O2) of the blood.
The curve in black represents the hemoglobin dissociation curve at a normal blood pH.
You can observe a shift of the curves when the temperature, the PCO2 and hence the pH of the blood vary (represented by the dotted curves). This phenomenon is called the Bohr shift. It demonstrates that the pH, the PCO2 and the temperature of the blood have an influence on the oxygen carrying capacity of the hemoglobin (the higher the percent saturation, the higher the oxygen carrying capacity).
Thus, for example, for a same PO2 equal to 50 mmHg, the percentage of saturation of the hemoglobin is lower in muscular capillaries, where, because there is a high rate of respiration, the PCO2 is high and the pH is low (corresponding to the lowest dotted curve) than in arterial blood where the PCO2 is lower (logical bc correlated with a highly oxygenated blood).
Sickle cell anemia is a disease that blood’s ability to carry oxygen and its oxygen carrying capacity. In sickle cell anemia, red blood cells are crescent shaped, and cannot flow through the capillaries. |
Figure 32 : accumulation of crescent-shaped red blood cells in the vessels of someone sick of sickle cell anemia.
Transport of CO2 :
CO2 is carried in venous blood.
It can be transported in three different forms.
First, 5 to 7 percents of the CO2 carried in the blood is directly dissolved in the plasma. It is more soluble in blood than oxygen.
Second, about 10 percents of the carbon dioxide reversibly bind to hemoglobin (thus forming a molecule called carbaminohemoglobin) or other blood proteins.
Third, the majority of carbon dioxide is carried as bicarbonate molecules (HCO3-) and are hence part of the buffer system. Molecules of carbon dioxide enter the red blood cells by diffusion, where an enzyme called carbonic anhydrase converts them in molecules of carbonic acid (H2CO3). Molecules of carbonic acid are very unstable and quickly dissociate into a proton H+ and a molecule of bicarbonate HCO3-.
As the carbon dioxide quickly transforms into bicarbonate, more and more molecules of CO2 enter the red blood cells and hence, more and more H+ is produced, which induces a decreasing in the pH. To avoid a shift in pH that would be too problematic, the hemoglobins bind to the protons that are released.
As for the molecules of bicarbonate that are produced, they get out the red blood cells in exchange for a chloride ion (Cl-) in a process called the chloride shift. When the blood arrives at the lung, the molecules of bicarbonate re-enter the red blood cells, in exchange for a chloride ion. The protons dissociate from the hemoglobin and bind again to the bicarbonate molecules, which produces a carbonate ion which is directly converted back into a carbon dioxide molecule by the carbonic anhydrase, before getting out of the red blood cell by diffusion down the concentration gradient and being released in the air by the lungs.
In the red blood cells travelling through alveolar capillaries, the predominating reaction is the following :
Hb+4O2→Hb(O2)4
Not so fun fact : Carbon monoxide poisoning occurs when carbon monoxide molecules bind to the hemoglobin in the blood. Contrarily to the bonds between oxygen/carbon dioxide and hemoglobin, the carbon monoxide – hemoglobin bond is not reversible, so there is no more binding sites available for oxygen and the individual quickly dies because of the lack of oxygen.
In this part, we spoke about hemoglobin because it is the most frequently used pigments for oxygen carrying. But more generally, respiratory pigments such as hemocyanin, hemerythrin pigments or heminic pigments are molecules that constitute and evolution increasing oxygen carrying capacity of the blood.
It will be useful to also include concepts of cardiovascular diseases. Concepts like atherosclerosis, heart attack, stroke and hypertension.
References for this section :
Text :
Common to all parts :
- Mastering Biology: Circulation and Gas Exchange
- Vergé Kemp, J., Yatim, A., Saïddi, M., Guichard, M., (2018), Gas exchanges and Circulation
- Reece, Campbell Biology 9th edition
Part 1)
- Wikipedia, visited in January of 2019, Article : Hemolymph
- Reuben Westmaas. (2017). Almost Every Mammal Gets About 1 Billion Heartbeats. Retrieved at https://curiosity.com/topics/almost-every-mammal-gets-about-1-billion-heartbeats-curiosity/
Part 2)
- Chintapalli, R.T.V., Hillyer, J.F., (2019). Hemolymph circulation in insect flight appendages: physiology of the wing heart and circulatory flow in the wings of the mosquito Anopheles gambiae, Journal of experimental biology.
- Watts, S.W., Morrison, S.F., Davis, R.P., Barman, S.M., (2012), Seretonin and blood pressure regulation, Pharmacological reviews,
Parts 3 and 4)
- Schaffer, F., McCraty, R., Zerr, C.L., (2014), A healthy heart is not a metronome : an integrative review of the heart’s anatomy and heart rate variability, Frontiers in Psychology, https://doi.org/10.3389/fpsyg.2014.01040.
- Claude GILLOT, Jean PAUPE, Henri SCHMITT, « CIRCULATOIRES (SYSTÈMES) – Appareil circulatoire humain », Encyclopædia Universalis [en ligne], visited in february 2019.http://www.universalis.fr/encyclopedie/circulatoires-systemes-appareil-circulatoire-humain/
- Fédération française de cardiologie, le fonctionnement du coeur, visited in february 2019 https://www.fedecardio.org/Je-m-informe/Le-coeur/le-fonctionnement-du-coeur
- Circulation systémique repéré dans Wikipédia, l’encyclopédie libre visited in January of 2019 https://fr.wikipedia.org/wiki/Circulation_systémique
- Khan Academy, the heart is a double pump, visited in february 2019 https://www.khanacademy.org/science/health-and-medicine/circulatory-system/circulatory-system-introduction/a/the-heart-is-a-double-pump
- Circulation pulmonaire repéré dans wikipédia, l’encyclopédie libre visited in January of 2019 https://fr.wikipedia.org/wiki/Circulation_pulmonaire
- Khan Academy, Joshua Cohen, Systolic murmurs, diastolic murmurs, and extra heart sounds – Part 1, visited in february 2019 https://www.khanacademy.org/science/health-and-medicine/circulatory-system-diseases/heart-valve-diseases/v/systolic-murmurs-diastolic-murmurs-and-extra-heart-sounds-part-1
- Coeur repéré dans wikipédia, l’encyclopédie libre visited in february of 2019 https://fr.wikipedia.org/wiki/Cœur
- Khan Academy, Rishi Desai, two circulation in the body, visited in february 2019 https://www.khanacademy.org/science/health-and-medicine/circulatory-system/circulatory-system-introduction/v/two-circulations-in-the-body
Part 5)
- Asaio, J., (2014), BLOOD SUBSTITUTES : EVOLUTION FROM NON-CARRYING TO OXYGEN AND GAS CARRYING FLUIDS. doi: 10.1097/MAT.0b013e318291fbaa
- Redmon, J.R., (date is unknown), The role of blood pigments in the delivery of oxygen to tissues.
- Alberts, B., Johnson, A., Lewis, J., Raff, M., Roberts, K., Walter, P., (2002). Molecular Biology of the Cell, 4th edition. New York : Garland Science
- Lumen Learning, (unknown date), Transport of gases in human bodily fluids. Retrieved from : https://courses.lumenlearning.com/boundless-biology/chapter/transport-of-gases-in-human-bodily-fluids/
Figures :
- Into gif : Giphy
- Figure 18 : Wikimedia. Retrieved from : https://commons.wikimedia.org/wiki/File:Figure_40_01_01ab.jpg
- https://commons.wikimedia.org/wiki/File:Fish_circulation.PNGFig 19: Wikimedia. Retrieved from :
- Fig 20: Giphy. Retrieved at : https://giphy.com/gifs/mQzMMG2T30hwI
- Fig 21: Scheme by June Vergé Kemp
- Fig 22: Wikipedia. Retrieved from : https://en.wikipedia.org/wiki/Circulatory_system
- Figure 23: Scheme by June Vergé Kemp
- Figure 24: Wikimedia. Retrieved from : https://commons.wikimedia.org/wiki/File:2027_Phases_of_the_Cardiac_Cycle.jpg
- Fig 25: Table by Maelle Dagnogo, Lorenzo Bernard, Maria Galiarnyk
- Figure 26: Wikipedia. Retrieved from : https://en.wikipedia.org/wiki/Blood_vessel
- Figure 27. a: Wikimedia. Retrieved from: https://commons.wikimedia.org/wiki/File:2112_Vessel_Blood_Pressure_Relationships.jpg
- Figure 27. b: Wikimedia. Retrieved from: https://commons.wikimedia.org/wiki/File:2109_Systemic_Blood_Pressure.jpg
- Figure 28: Wikimedia. Retrieved from : https://commons.wikimedia.org/wiki/File:2105_Capillary_Bed.jpg
- Fig 29: Scheme by June Vergé Kemp
- Figure 30: Scheme by June Vergé Kemp
- Figure 31: Wikimedia. Retrieved from : https://commons.wikimedia.org/wiki/File:Figure_39_04_02.png
- Figure 32: Giphy. Retrieved at : https://giphy.com/gifs/discoverychannel-discovery-blood-cells-xT9IgkwR8wkzvDh68M
Animal physiology and function
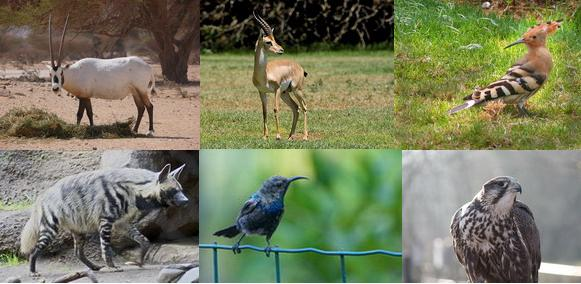
Made by Leopoldine Taïrou, Carlotta Zanon and Oanelle Gléonec.
Prerequisites
- Animal classification : mammals, fish, vertebrates …
- General internal organisation : skeleton, organs …
- General knowledge about cells : composition, functions ….
Introduction
Contrary to what one might think, it is difficult to define what an animal is. Some scientists think that it is an organized living being, endowed with sensitivity and able to move. According to NASA, an animal is a living being which have the ability to capture energy from the environment and transform it into growth and reproduction. They metabolize to achieve a balance of the parameters of their internal environment. Also, they are able to respond to stimuli and react.
Animals are present on almost the whole surface of the Earth and, consequently, there is a great diversity. Despite this, all animals have the same needs : obtain oxygen and water, feed, reproduce and fight against diseases.
Thus, all species have undergone adaptations to survive in their environment through natural selection. This allowed species to have specific structures according to their place of life. They have acquired characteristics that increase the efficiency of the acquisition and use of resources at their disposal. Their size, shape and functionality significantly affect their interactions with their environment.
Anatomy is the study of structures of an organism and physiology is the study of functions of the performances of an individual. This is what we will study in this chapter to understand animals structures at tissue level but also about their internal regulation mode.
Plan
- What makes an animal ?
- General organisation
- Epithelial tissue
- Connective tissue
- Muscle tissue
- Nervous tissue
- Exchanges with their environment
- Common regulation
- Introduction
- Basic regulation (Homeostasis)
- Internal temperature
- Energy acquisition
- Metabolic rate
- Basal metabolic rate / Standard metabolic rate
- Factors influencing metabolic rate
- What amount of energy is used for which function ?
I – What makes an animal ?
a/ General organisation
Animals have several levels of organisation. The last level of organisation is the organisation plan. It is the description of animal’s morphological and functional regionalisation, principals system as well as anatomic and functional relations between them. This organisation plan is put in place by several stimulus during the animal development (see chapter Animal’s development).
The organ system is the precedent level of organisation. It is a set of organs participating to the realization of the same biological functions (ex : digestive or respiratory system).
Then, an organ is a structure formed by several tissues that contribute to the realization of a specific function (ex: the lung participate in air exchanges). Tissues are made of cells with a similar appearance and a common function.
The cell is the first level of organisation. Metazoa are animals that have several cells organized in different tissues. In the present chapter we are focusing on them.
The animal body has four type of tissues : epithelial, connective, muscle and nervous.
b/ Epithelial tissue
Epithelium = polarized set of juxtaposed cells, joined by junction structures, organized in one or more layers, making a transition between the body and the outside or between various compartments of the body. They function as a barrier against mechanical injury, pathogens and fluid loss.
Epithelial tissues can be found lining the outer surfaces of organs and vessels throughout the body, as well as the inner surfaces of in many internal organs.
All epithelia follow 3 criteria :
- Relies on connective tissue, usually via a basement membrane
- Are polarized
- Are devoid of vascularization

The term polarization refers to the fact that epithelial cells have a “up” side and a “down” side.
The “up” side is the apical surface and its function differs from the types of epithelia.

The “down” side is called the basal surface and is the one relying on connective tissue to perform exchanges of nutrients and oxygen.
Epithelial tissues can be classified into two major groups according to their predominant function:
- protection and exchange → coating epithelia
- secretion → glandular epithelia
Coating epithelia
Main characteristics of coating epithelia, beside their exchange and protection functions is that they are not vascularized, are all renewed from stem cells and and some of them have also the sensory function.
There are numerous coating epithelia in a body and they are usually classified by their cell shape and by their layers number. A main example of coating epithelium is the outer layer of the skin : the epidermis.
Here is a table classification of coating epithelia based on the first couple of criteria :


Another type of epithelium exists, called transitional epithelium. Cells of this epithelium can change form and therefore adapt. An example is the urinary epithelium : its cells allow to expand and stretch.
Then they are also classified with a third criteria : the differentiation of their superficial shape. (if needed) :

Glandular epithelia
Glandular epithelia produce products that are excreted, they can be organs (ex : pancreas) or into coating epithelia (ex : fundic glands of stomach). They can be exocrines or endocrines.
Endocrine glands eject their products into the blood (= hormones) whereas exocrine ones eject their products into the outside environment (sebaceous glands).
(see chapter Hormones and the endocrine system : what is it and how does it work?)
c/ Connective tissue
The main function of connective tissue is to protect and support other tissues.
But they also have various role in the body :
- In Connection and binding : tendon and ligaments for example
- In exchange and nutrition : epithelium are not vascularized and depend on connective tissue to provide them with nutrients.
- In the body defense by hosting immune cells : connective tissue is the starter area of inflammatory response.
- In tissue repair : cells of connective tissue synthesize the extracellular matrix
- In storage : this tissue can stock lipids, phosphore, calcium …
- In transportation : blood as example
- In controlling other tissues : by producing growing factors that influence on vessels and epithelium
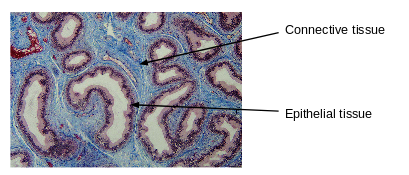
To operate all these previous functions, there is a wide variety of connectives tissues but they have all contain common elements.
This tissue is composed of non-joined cells scattered into the extracellular matrix, also composed of networks of fibers into the ground substance.
The ground substance is constituted by a network of glycosaminoglycans (long unbranched polysaccharides) and they exchange with cells via hyaluronic acid or glycoproteins.
Fibroblasts are the only type of cells found in all connective tissues. They synthesize the extracellular matrix, fibers and glycoproteins.
There are 3 types of fibers (also called fibres) into the extracellular matrix:
- collagenous fibers : for mechanical strength
- elastic fibers : for elasticity
- reticular fibers : for joining other tissues
Other types of cells found in connective tissues are :
- Macrophages : they phagocytes the particle recognized as enemy of the body, and take its antigens to lymphocytes T to enclenche the immunitary response.
- Mast cells : type of white blood cells that release mediators to induce inflammation.
- White blood cells : family of cells that go from phagocytes cells to lymphocytes.
Various types of connective tissues exist and are differentiated by their proportions of cells, fibers and ground substance and by their particularities :


d/ Muscle tissue
Muscle tissue allows movements of the animal body. It contains specialized filaments of proteins called actin and myosin that have the capacity to contract.

In vertebrates they are 3 types of muscular tissues :

Skeletal tissue (striated)
This tissue is associated to the skeleton, allows a quick and voluntary contraction and is associated to connective tissue to form muscles.
There are 2 part into the muscle formed :
- the central one which is the contractile part
- the two extremities of the central part : tendons

Skeletal muscle tissue consists of a set of striated muscle cells which are never isolated.
Actin and myosin filaments are in the center of the cell and they are called myoplasm.


Into a striated muscle, actin and myosin filaments are organised according to the explanation shown below :
One set of the previous association is called a sarcomere : it is the basic unit for muscle contraction.
This special organisation allows the myoplasm and so the muscle to contract :

Smooth muscle (non-striated)
This type of tissue is found into the wall of viscera and vessels, its contraction is slow, involuntary and sustained for a time ranging from a few seconds to a few minutes.
The main differences to the striated muscle tissue is the organisation and composition of acto-myosin filaments which does not form sarcomeres, and the innervation of the tissue. (Skeletal muscle → somatic nervous system / Smooth muscle → autonomic nervous system)
Cardiac muscle
This type of tissue is around the heart and its contraction is rhythmic, spontaneous and involuntary.

As the skeletal muscle tissue, cardiac tissue is striated but the contractile filaments are at the periphery of the cells and not in the center.This tissue contain structures that allow the electrical potential to flow from cell to cell : intercalated discs. They allow the rhythmic contraction of all the cells.
e/ Nervous tissue
Nerve tissue is a tissue specialized in receiving, integrating and processing information that comes from either the body or the environment. It is also specialized in providing adapted answers.
Into the nerve tissue (=nervous tissue), there are 2 categories of cellular populations :


For bilaterals animals, the nervous system is divided in 2 parts:
- the central nervous system CNS : contain the majority of the nervous system and is constituted by the brain and the spinal cord.
- the peripheral nervous system PNS : is composed of all nerves and neuroglia outside the CNS.


II- Exchanges with their environment
There are lots of exchanges happening between animals and their environment. These exchanges happen at exchange surfaces, substances pass through the plasma membrane thanks to active transport or passive transport.
- Gas exchanges : Animals have different form of respiration, always on the base of a gas exchange with the environment (see chapter Gas exchanges). Respiration is realized thanks to the respiratory system. These exchange speeds are proportional to the membrane surface.
- Nutrients and waste : Animals exchange nutrients and waste with their environment. It is proportional to the membrane surface.
- Heat exchanges : Animals exchange heat with their environment. We will focus on that into the next part.
The quantity of exchanges depends on the number of cells of the organism. The amount of substances an animal needs to live is proportional to the volume of a cell. Moreover, the ratio of surface area per unit of volume is bigger for a small cell compared to a bigger one with the same shape. The ratio of surface area for unit of volume decreases as the cell become bigger. That’s why cells are small. Indeed, if the cell grows beyond a certain limit they will not be enough surface for all the material it needs to cross the membrane. Thus, if cells get to this limit they divide into smaller cells.
The cell of an unicellular organism has enough surface in contact with the environment to do all the exchange it needs. By comparison, a multicellular organism has a lot of cells organised in a compact mass that decrease their external surface. So they need to perform exchanges between cells. In large multicellular organisms, the immediate environment of cells is a sort of fluid tissue. For vertebrates, this interstitial fluid is an exchange medium between body cells and the circulatory system.
III- Common regulation
a/ Basic regulation : Homeostasis
Homeostasis is a dynamic state of equilibrium found in living things, so in animals. An example of homeostasis is the blood sugar level : In order to the body maintain its normal functioning, the blood sugar level has to be maintained around a certain level (1g/L) but with eating or fasting this level vary but the body is always trying to keep the level around the reference value.
This equilibrium is called dynamic because it never completely stabilizes (a stabilized system is a dead system).
In every case of homeostasis regulation, a reference value is called a set point.
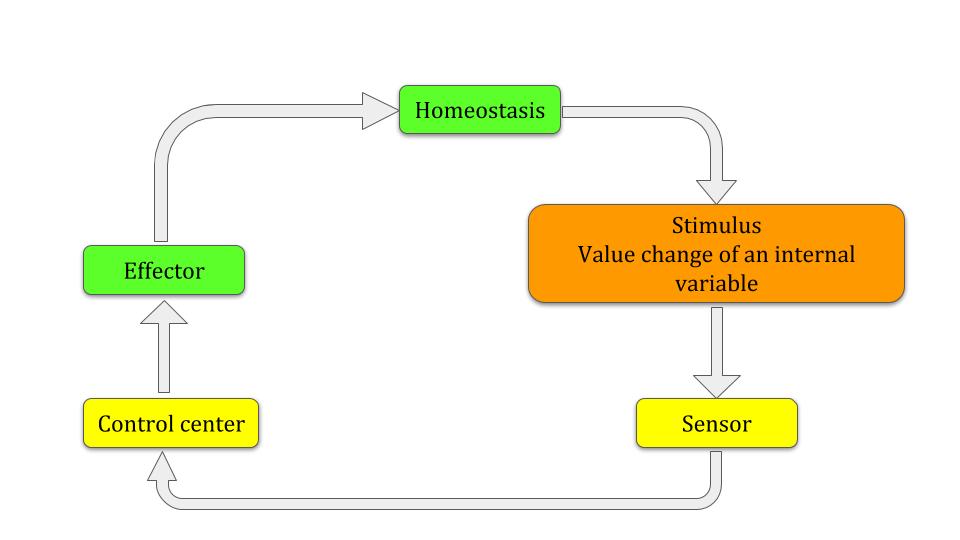
Homeostasis is usually maintained by negative feedback loops, which aim is to stabilize the fluctuation, to be opposed to it, inhibits the changes.

An example is the regulation of the body temperature :

And as opposite, some body process are driven by positive feedback loops that amplify the change triggered by the stimuli.
An example is the contractions during the child delivery :
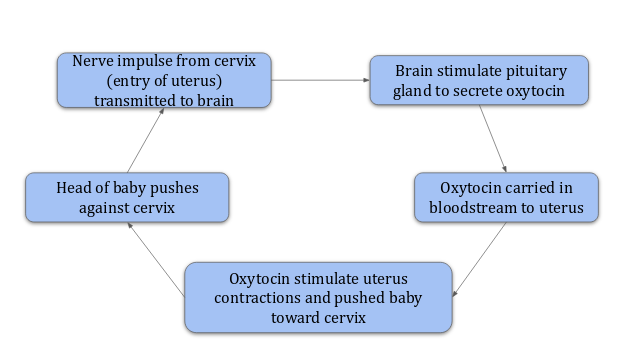
But the value of a set point can vary depending on conditions. For examples, adolescence is a period of life when the body is experiencing hormonal level changes. This changes can also be cyclic. As an example, a lot of body constants vary depending on the time of the day, like temperature and cardiac frequency decrease during the night. This daily cyclic variations are know under the name of circadian rhythm.
b/ Internal temperature: Thermoregulation
So that animals always have the right body temperature, they regulate themselves via thermoregulation. Thermoregulation is the ability to maintain optimal body temperature even when the ambient temperature is different.
Endotherms and ectotherms:

Endotherms, such as Birds and Mammals, use their metabolic heat (heat produce by the chemical reactions in the body) to maintain a stable internal temperature, often one different from the environment.

Ectotherms, like lizards and snakes, do not use metabolic heat to maintain their body temperature but take the temperature from the environment.
In any case, animals are not strictly endotherm or ectotherm, in fact, they are not exclusive modes of thermoregulation (somme Mammals can warm up in the sun). Also there are heterothermal organisms that change their core temperature according to the period.
Endothermic animals create their own warmth, they :
- Are able to live in extreme temperatures
- Need to eat a lot because of perform metabolic reaction
- Poorly tolerate internal temperature changes
Ectothermic animals use environment to have warmth, they :
- Don’t need a lot of nutrients ( like in deserts, …)
- Tolerate internal temperature fluctuations
- Adapt to have the right temperature (sun, shadow,…)
Body temperature variation:

Poikilotherm: when the body temperature varies.

Homeotherm: when the body temperature is constant
There is not direct link between the temperature variation and the internal temperature.
Some fish live in a constant temperature water, so their body temperature is constant but despite it, they are ectotherms.
Find the balance between too much heat and too much cold
All animals exchange heat through four physical processes: conduction, convection, radiation and vaporization.

This picture shows the characteristics of each exchange between the organism and the environment. It must be remembered that the heat always propagates from the highest temperature to where it is lower.
The thermoregulation is the equilibrium between the production (or gain) of heat and the heat lost.
Animals manage to use it through mechanisms that can reduce heat exchange or through heat passages in a certain direction.
Thermoregulation is associated with the integumentary system in mammals. This system corresponds to the outer layer of the body, like skin, hair and nails (or hoof, or claw, depending on the species).
There are 5 general adaptations which help animal’s thermoregulation.
1. Insulation
The insulation reduces the heat flow between the body and the environment in Mammals and Birds. It also helps to decrease the energy cost and therefore maintain the temperature.
The insulation is made thanks to fur, feathers and the fat deposit in the adipose tissues. Thus, these animals have insulating layers that reduce heat loss.
Most Mammals and Birds inflate their fur or feathers to trap a thicker layer of air to increase insulating capacity, like this pigeon. This is also the phenomenon that we find when human have goosebumps. Indeed, their hair are bristling, showing the fur swelling of their hairier ancestors.
Then, some of these animals must repel the water because it would reduce their insulating capacity. To do so, they secrete oily substances. This is the case in birds that use it for smoothing their feathers.

Marine mammals, such as whales or walruses, need better insulation because they live part of the year in polar seas, whose temperature is close to 0 ° C. The conduction is then 50 to 100 times faster than in the air. Despite this, their body temperature is between 36°C and 38°C and their metabolism is similar to that of terrestrial mammals of the same size. This is thanks to the very thick layer of fat they have under the skin called blubber.
2. Regulation of blood circulation
The circulatory system plays a very important role in heat exchange. Adaptations are essential for thermoregulation, such as the circulation of blood near the surface of the skin or keeping the heat in the center of the body. Thus, some animals are able to modify the amount of blood that circulates between the inner part of the body and that close to the skin depending on the temperature.
Vasodilation allows a higher blood supply due to the widening of the diameter of the superficial blood vessels. This phenomenon is triggered by a nerve impulse that orders the relaxation of the muscle fibers of the wall of the blood vessels. As a result, there is a greater circulation of blood and therefore an increase in body heat. This phenomenon also increases radiation, convection and conduction in endotherms.
In contrast, vasoconstriction reduces blood supply and heat transfer by decreasing blood vessels diameter. This allows the hares to not get too hot in the desert thanks to the large surface of their big ears.
In Mammals and Birds, there is another process to reduce heat loss. Countercurrent heat exchange allows heat transfer between liquids that flow in opposite directions (between arteries and veins). Thus the warm blood that comes from the center through the arteries transfers its heat to the colder blood which returns from the extremities through the veins. The fact that the blood flows in opposite directions maximizes the heat transfer along the entire length of the exchanger.
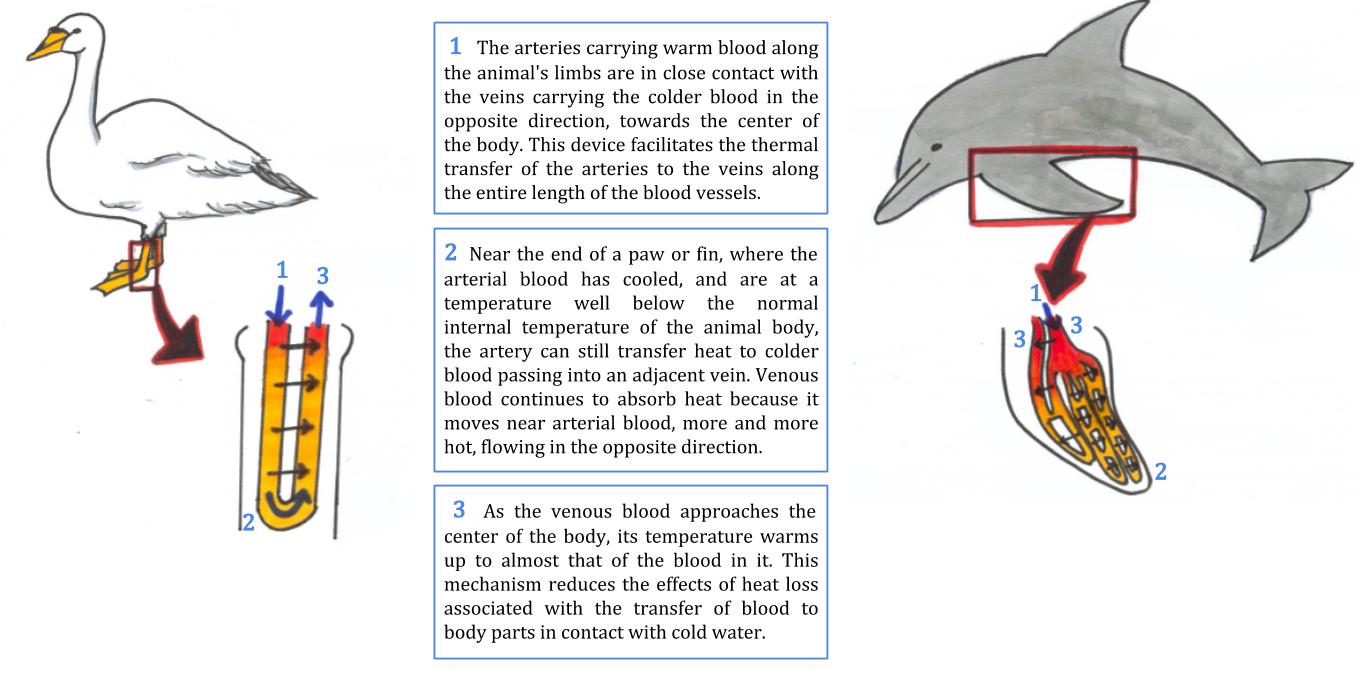
Some fishes and insects use this process to support their vigorous and sustained activities. For example, white shark or tuna use countercurrent heat exchange to keep the main swimming muscles at temperatures a few degrees higher than on the surface of their body.
Similarly, in bumble bees or bees, this process is used to maintain a higher temperature in the thorax, where the wing muscles are located.
Finally, this mechanism can be deactivated to dissipate the heat released by the muscles. This can be the case for bees when they forage under a strong heat.
3. Cooling by heat loss due to vaporization
Mammals and Birds live in places where it may be necessary to warm up or cool down.
If the external temperature is higher than the body temperature, then the animal gains heat while it continues to create heat. In order to don’t have too rapid rise in temperature, evaporation through the skin or by breathing is used.
Water has the ability to remove heat from the body surface by absorbing a large amount of heat during evaporation.

Some Mammals and Birds also have adaptations that increase the body’s cooling. This is the case of panting, often applied by dogs. This process allows internal cooling through air saturated with water. Some Birds have a specialized bag in the floor of their oral cavity that is highly vascularized. Its swelling and rapid deflation promotes vaporization.
Mammals have sweat glands which are regulated by the nervous system and allow to lower the body temperature. Sweating or splashing with water wets the skin and increases vapor cooling.
4. Behavioral reactions
Endotherms and ectotherms vary their temperature by adapting their behavior to environmental changes. Whether alone or with others, the ectotherms keep a constant temperature thanks to simple behaviors. Hibernation and migration are behavioral adaptations to extreme temperature conditions.
All Amphibians and most reptiles are ectothermic and owe the temperature of their bodies to their behavior. When it’s cold, they look for warm places by adopting optimal positions to expose themselves to the heat source and increase the thermal ratio. On the contrary, when it is hot, they withdraw from the heat zone or simply change position by orienting themselves differently.
Then, many terrestrial invertebrates modify their internal temperature due to behavioral mechanisms similar to ectothermic vertebrates.

This is the case of the Desert Locust, which must reach a certain temperature to jump. On cold days, it changes its position in relation to the sun’s rays to increase its heat and does the same for warm days.
Finally, it is also possible to see thermoregulations depending on social behavior. Honeybees increase their heat production on cold days and pile up to keep it. Bees on the periphery of the cluster move to the center to distribute the heat. When it is hot, they carry water to the hive and flap their wings to encourage spraying and convection.
5. Adjustment of metabolic heat production
Endotherms usually have a higher body temperature than their environment and must compensate by heat loss. They can adjust the heat output according to heat loss through thermogenesis: the production of heat.
The increase of the muscular activity, either by movements or by chills allows to warm up. However, the animal must consume enough food to be able to warm up and get the heat it needs.
Some mammals produce hormones to induce mitochondria to increase their metabolic activity and to produce heat instead of ATP throughout the body; this is thermogenesis without shivering. Other mammals have brown adipose tissue in the neck and between the shoulders. These tissues have an abundance of mitochondria in each cell. Thus, a rapid production of heat is possible.
Thermogenesis without shivering allows mammals and birds to produce between 5 and 10 times more metabolic heat than when it is hot.
Then researchers have observed that some large reptiles become endotherms and have a constant temperature due to chills.
Finally, in the smaller endotherms, flying insects such as bees, the body temperature depends on the wing muscles. To fly away, the flying insects contract their wing muscles making them shudder. This process allows the cellular respiration to accelerate, and allowing the flight. As a result, they can fly when it’s cold, day or night.
Acclimatization in thermoregulation
Some animal species can, through acclimatization, endure conditions that they would not be able to survive if they were brutally exposed to it. Thus, acclimatization contributes to thermoregulation in many animal species. It can induce various changes in the physiology of animals, such as Birds and Mammals, by modifying the amount of skin insulator (the fur thickens for winter, then clears in summer, for example).
Such changes help these animals maintain a roughly constant body temperature regardless of the season.
In ectotherms, acclimatization often includes changes at the cellular level. The cells can produce isozymes, enzyme variants, having the same function with different optimal temperatures.
But enzymes are not the only ones to be able to change. Indeed, the proportion of saturated and unsaturated lipids in the membranes can also change. For example, unsaturated lipids allow membranes to remain fluid despite changes in temperature.
Then, certain ectotherms, able to reach a body temperature below zero, protect themselves by producing « antifreeze » compounds that prevent the formation of ice crystals in the cells. It is thanks to these compounds that the fish living in the polar oceans manage to survive in waters at -2 ° C.
Physiological thermostat and fever
The regulation of body temperature is a complex system that facilitates the various feedback mechanisms. The receptors associated with thermoregulation are located in the brain, the hypothalamus. It is a group of regulating neurons that function like a thermostat: if the temperature is above or below a certain temperature, the hypothalamus will activate mechanisms seen earlier to lose or gain heat. When the temperature returns to normal, the mechanisms stop.
After certain bacterial infections, the body temperature increase : it is fever.
For ectotherms, it is common for several species to settle warm to maintain a temperature of 2°C to 4°C more.
IV- Energy acquisition
To gain energy and grow, animals take nutrients in their environment through food : they are heterotroph. Nutrients are retrieved from the food they ingest thanks to the digestive system (see chapter Animal digestive system). After been acquired, food must be broken down and absorbed. Food is digested by enzymatic hydrolysis and the energy from food is used to make ATP through cellular respiration.
The transfer and transformation of energy in animals are called bioenergetic processes. They determine the animal’s nutritional needs ; it depends on its size, activity and environment. Animals use the chemical energy from food to maintain their metabolism and activities.
Metabolism is the total of all physical and chemical changes that take place within an organism. Thanks to the energy acquired cells, organs and system accomplish the organism vital functions.
a/ Metabolic rate
Metabolic rate is the quantity of energy used by an animal during a given time; it is the sum of all the biochemical reactions associated to energy expense during this period. We measure it in kJ per unit of time.
Measuring metabolic rate is very important, it is not only useful to physiologists, but also to ecologists, animal behaviorists, evolutionary biologists, and many other fields of study. Indeed, the metabolic rate can provide information about the energy required by an animal to function. It can tell us how much energy an animal needs to expand, fly, swim, run, or walk.
It is also interesting because it allows us to learn about the processes of tissues growth and reparation, chemical, osmotic, electrical, and mechanical internal work, and external work that is needed for locomotion and communication.
There are several ways to determine this rate :
- According to the Laws of Thermodynamics, all of the changes occuring will release heat so metabolic rate can be measured with the heat production of an animal. To do so we have to use a calorimeter.
- We can measure the quantity of dioxygen consumed or carbon dioxide produced during cellular respiration.
We can also count the quantity of food eaten and calculate the energy within it as well as the chemical energy lost in waste.
b/ Basal metabolic rate and standard metabolic rate
Animals always need to maintain a minimal metabolism to accomplish all the vital functions of the body. This minimal metabolic rate isn’t the same for endotherms and ectotherms :
- For endotherms, it is the basal metabolic rate (BMR). It is the metabolic rate at rest while the individual is awake; the energy expenditure at a complete bodily rest in a thermoneutral environment after the digestive system has been inactive for about 12 hours. It eliminates the variable effect of physical activity. It can be measured in an environment at a temperature for which the animal does not lose or produce heat.
- For ectotherms, it is the standard metabolic rate (SMR). It is the metabolic rate of a fasting, resting ectotherm, below which physiological function is impaired. It is the basic cost of living at a certain temperature. It is really important to measure it at a given temperature because thermic variations of the environment influence the ectotherms internal temperature.
The comparison of these two metabolic rates shows that endotherms and ectotherms have different energetic expenses.
c/ Factors influencing the metabolic rate
Some factors influence the metabolic rate such as age, sex, size, activity, alimentation, environment…
Link between size and metabolic rate
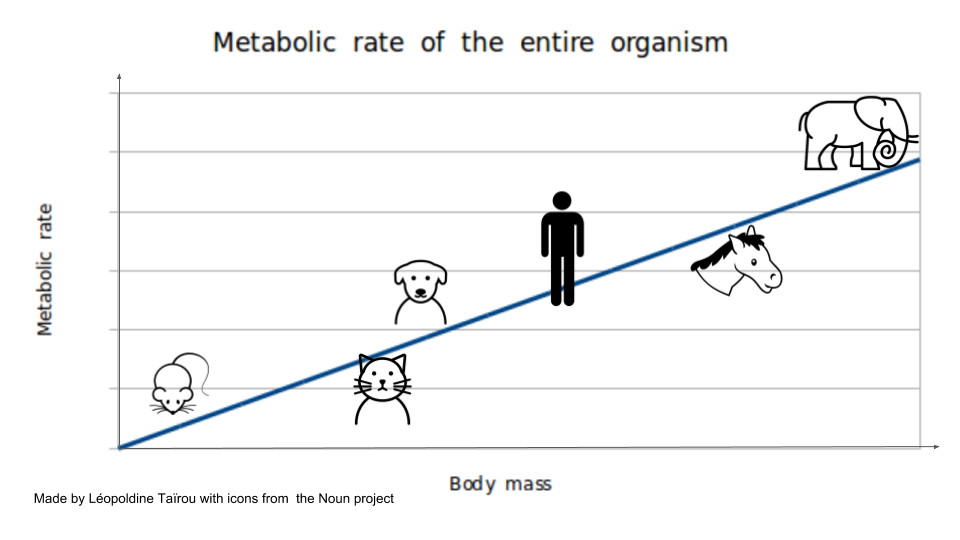

Which one has a higher basal metabolic rate: a small animal like a mouse or a big one like an elephant? When we look at the metabolic rate of the entire organism, the elephant definitely has a bigger one because there is more metabolizing tissue in an elephant than a mouse. However, when we look at the per-mass metabolic rate, a small animal like a mouse has a bigger one than an elephant. Indeed, we can generalize this for all endotherms : the smaller the organism’s mass is, the higher its metabolic rate per mass of the body is.
How is that possible ?
Larger animals have a smaller surface area to volume ratio. Since body heat must be shed on the surface, this means that larger animals must produce less heat (=energy) per unit body dimension (=here for one gram of tissue) or they will get too hot too easily. At the opposite, smaller animals have a greater surface area to volume ratio, so more heat is lost.
Link between activity and metabolic rate
The basal metabolic rate (BMR) and standard metabolic rate (SMR) are measures of animals’ metabolic rate when they are quiet, not stressed out or excited, and not doing anything active. Any comportment equals an energy consumption higher to the basal or standard metabolism. A typical animal has an average daily rate of energy consumption higher than the animal’s BMR by about 222 to 444 times.
The more active an animal is, the more energy must be expended to maintain that activity, and the higher its metabolic rate will be. For example, if you play sports with your friends all day long you are going to get pretty hungry meaning that you need an energy input because you used a lot of energy. On the other hand, if you just stayed in bed watching series on Netflix you are not going to get that hungry because you used less energy. The animal’s metabolic rate determine how much food it has to eat to maintain its body at a constant mass. When an animal get less energy input (=food) than the energy it uses to function it will lose body mass and when an animal get more energy input than the energy it uses it will stock the leftover chemical energy as glycogen or fat. It is the basis weight gain and weight loss.
When an animal is growing, it need more energy than it basal or standard metabolism even though it doesn’t do a visible activity. Thus the metabolic rate increase and the energy input need to be bigger than the energy output.
d/ What amount of the energy is used for which function ?
Depending on their environment, size, activity and thermoregulation, animals use their energy differently.
We can compare different species :

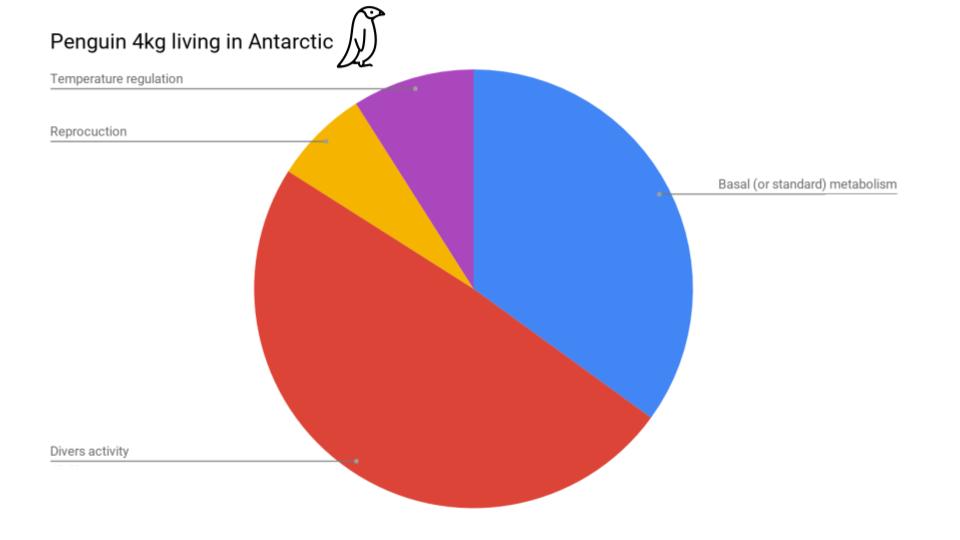

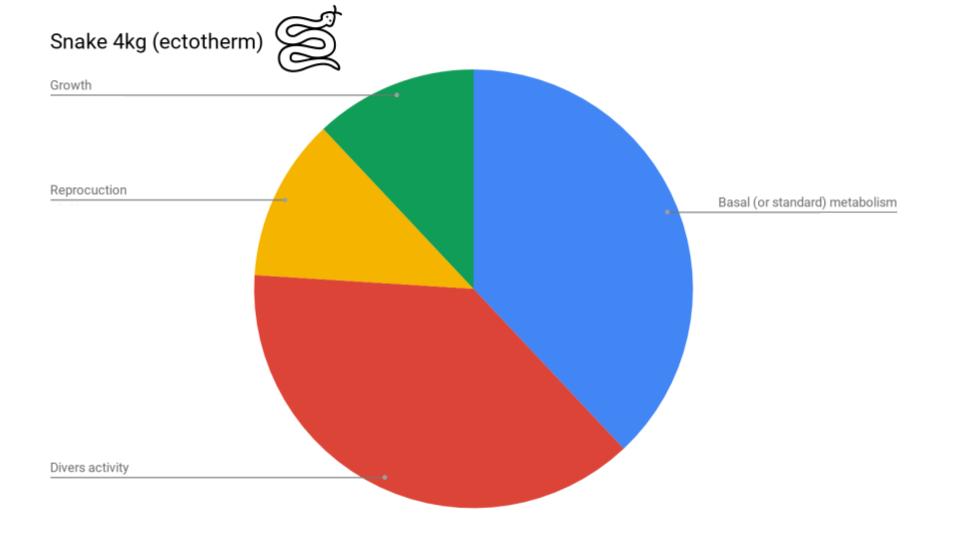
e/ State with low metabolic rate : how does it work and why ?
When there are important changes in their environment some animals needs to adapt by slowing down their metabolic processes and reducing their body temperature. They enter a state called torpor. It is a state of really low metabolism (lower than the BMR and SMR) and decreased activity that allows animals to survive in unfavorable conditions and/or conserve energy. It may be used over periods of different lengths.
- Long periods : Some animals goes into hibernation during the winter, they slow their metabolism and decrease their body temperature. It is a response to low temperature, shorter days and the lack of food. Other animals goes into estivation during the summer.
- Short periods : Some animals especially small Mammals and Birds have a daily torpor meaning that they enter a torpor state everyday. But it also can be sporadic in response to unfavorable conditions.

(https://www.goconqr.com/en-US/p/16828941-Animal-s-form-and-function-mind_maps)
References
Sources
1- What makes an animal ?
a/ General organisation
- Pierre Peycru, Didier Grandperrin, Christiane Perrier, Bernard Augère, Thierry Darribère, Jean-Michel Dupin, Caroline Escuyer, Jean-François Fogelgesang et al. (dir.). (2017) Biologie tout-en-un BCPST 1re année (4 ed.) France : Dunod
b/ Epithelial tissue
- Bryant DM and Mostov KE (2008). From cells to organs: building polarized tissue. Nature Reviews Molecular Cell Biology. doi: 10.1038/nrm2523. From https://www.ncbi.nlm.nih.gov/pubmed/18946477
- Wikipedia contributors. (2019, January 25).Epithelium. Wikipedia. From : https://en.wikipedia.org/wiki/Epithelium
- Wikipedia contributors (2019, January 25). Microvillus. Wikipedia. From : https://en.wikipedia.org/wiki/Microvillus
- Wikipedia contributors. (2019, January 25). Cilium.Wikipedia. From : https://en.wikipedia.org/wiki/Cilium
- Wikipedia contributors. (2019, January 25). stereocilia in inner ear. Wikipedia. From https://en.wikipedia.org/wiki/Stereocilia_(inner_ear)
c/ Connective tissue
- Wikipedia contributors. (2019, January 27). Connective tissue. Wikipedia. From: https://en.wikipedia.org/wiki/Connective_tissue
- Wikipedia contributors. (2019, January 27). Ground substance. Wikipedia. From: https://en.wikipedia.org/wiki/Connective_tissue
- Wikipedia contributors. (2019, January 27). Extracellular matrix. Wikipedia. From: https://en.wikipedia.org/wiki/Extracellular_matrix
- Bryant DM and Mostov KE (2008). From cells to organs: building polarized tissue. Nature Reviews Molecular Cell Biology. doi: 10.1038/nrm2523. From https://www.ncbi.nlm.nih.gov/pubmed/18946477
- Wikipedia contributors. (2019, January 27). Glycosaminoglycan. Wikipedia. From: https://en.wikipedia.org/wiki/Glycosaminoglycan
- Laurent Degos(1987). Lexique immunologique – Le rôle des macrophages. Médecine science. From: http://www.ipubli.inserm.fr/bitstream/handle/10608/3648/MS_1987_3_168.pdf?sequence=1
- Elaine Zayas Marcelino da Silva, Maria Célia Jamur & Constance Oliver. (2014, October 1). Mast Cell Function: A New Vision of an Old Cell. Journal of Histochemistry & Cytochemistry. doi: 10.1369/0022155414545334. From: https://www.ncbi.nlm.nih.gov/pmc/articles/PMC4230976/
- Connective Tissue lab. Yale. From : http://medcell.med.yale.edu/histology/connective_tissue_lab.php
- Whats Up Dude, H. (2018, February 15). Types Of Connective Tissue – What Is Connective Tissue – Functions Of Connective Tissue [Video file]. From https://www.youtube.com/watch?v=4HNbspnFyIE
d/ Muscle tissue
- Wikipedia contributors. (2019, January 30). Muscle type. Wikipedia. From: https://en.wikipedia.org/wiki/Muscle#Types
- Wikipedia contributors. (2019, January 30).Muscle tissue. Wikipedia. From: https://en.wikipedia.org/wiki/Muscle_tissue
e/ Nervous tissue
- Wikipedia contributors. (2019, January 30). Nervous tissue. Wikipedia. From: https://en.wikipedia.org/wiki/Nervous_tissue
- Wikipedia contributors. (2019, January 30). Neuron. Wikipedia. From: https://en.wikipedia.org/wiki/Neuron
- Wikipedia contributors. (2019, January 30). Central nervous system. Wikipedia. From: https://en.wikipedia.org/wiki/Central_nervous_system
2- Exchanges with their environment
- Mike Boyle (2016) ,Biology: Topics 3 and 4 – Organisms Exchange Substances with Their Environment, Genetic Information, Variation and Relationships Between Organisms , UK : HarperCollins Publishers. From https://www.aqa.org.uk/subjects/science/as-and-a-level/biology-7401-7402/subject-content/organisms-exchange-substances-with-their-environment
- Bakken, George. (1976). A heat transfer analysis of animals: Unifying concepts and the application of metabolism chamber data to field ecology. Journal of theoretical biology. DOI: 10.1016/0022-5193(76)90063-1. From : https://www.researchgate.net/publication/22196683_A_heat_transfer_analysis_of_animals_Unifying_concepts_and_the_application_of_metabolism_chamber_data_to_field_ecology
- BioDotEdu. Why are cells so small. From: http://www.brooklyn.cuny.edu/bc/ahp/LAD/C5/C5_ProbSize.html
3- Common regulation
a/ Basic regulation (Homeostasis)
- Wikipedia contributors. (2019, February 3). Homeostasis. Wikipedia. From: https://en.wikipedia.org/wiki/Homeostasis
- Khan Academy. Homeostasis. Retrieved February 11, 2019, from https://www.khanacademy.org/science/high-school-biology/hs-human-body-systems/hs-body-structure-and-homeostasis/a/homeostasis
b/ Internal temperature
- Science Direct- Elsevier. Body temperature regulation. From : https://www.sciencedirect.com/topics/medicine-and-dentistry/body-temperature-regulation
- Khan Academy. metabolic rate. Retrieved February 14, 2019. From : https://www.khanacademy.org/science/biology/principles-of-physiology/metabolism-and-thermoregulation/a/animal-temperature-regulation-strategies
- Jared Harding (2014). How do animals regulate their body temperature? Ocean adventure. From : http://oceanadventures.co.za/animals-regulate-body-temperature/
- Lionel CAVIN. Lampris Guttatus. Encyclopædia Universalis. Retrieved february 14, 2019. From : https://www.universalis.fr/encyclopedie/lampris-guttatus/1-animaux-homeothermes-et-poikilothermes-endothermes-et-ectothermes/
- McCafferty, Dominic & Pandraud, Guillaume & Gilles, Jérôme & Fabra-Puchol, Maria & Henry, Pierre-Yves. (2017). Animal thermoregulation: A review of insulation, physiology and behaviour relevant to temperature control in buildings. Bioinspiration & Biomimetics. DOI: 10.1088/1748-3190/aa9a12. From : https://www.researchgate.net/publication/321047502_Animal_thermoregulation_A_review_of_insulation_physiology_and_behaviour_relevant_to_temperature_control_in_buildings
- Raymond Gilles. (2006). Chapter : Environnement extérieur. Physiologie Animale. Belgique : Edition De Boeck & Larcier. From : https://books.google.fr/books?id=mK-GSuHEkw0C&pg=PA638&lpg=PA638&dq=oiseaux+haletement&source=bl&ots=AmRkRVEcxn&sig=ACfU3U1CiK5t_JFa-VUjAsB3FUvTooaTcg&hl=fr&sa=X&ved=2ahUKEwicutacz5XgAhV5gM4BHfvbAaQQ6AEwBXoECAMQAQ#v=onepage&q=oiseaux%20haletement&f=false
- Wikipedia contributors. (2019, February 14). Convective heat transfer.
4- Energy acquisition
- Healy K, McNally L, Ruxton GD, Cooper N, Jackson AL (2013). Metabolic rate and body size are linked with perception of temporal information. Animal Behaviour. doi: 10.1016/j.anbehav.2013.06.018. From : https://www.ncbi.nlm.nih.gov/pmc/articles/PMC3791410/
- K.L. Paradis, L.A. Pyzocha, M.A. Gibson, N.R. Dion, K.L. Niessink, A.M. Konefal, D.E. Facey (2000). Energetics and metabolism – The animal physiology study guide. From : http://academics.smcvt.edu/dfacey/animalphysiology/Metabolism/AnPhystemplate.htm
- Science Direct-Elsevier. Basal metabolic rate. From : https://www.sciencedirect.com/topics/neuroscience/basal-metabolic-rate
- Norin, T. Malte, H.(2011). Repeatability of standard metabolic rate, active metabolic rate and aerobic scope in young brown trout during a period of moderate food availability. Journal of Experimental Biology. doi:10.1242/jeb.054205. From : http://jeb.biologists.org/content/214/10/1668
- Khan Academy. metabolic rate. Retrieved February 14, 2019. From : https://www.khanacademy.org/science/biology/principles-of-physiology/metabolism-and-thermoregulation/a/metabolic-rate
- BBC. BBC Bitesize – Higher Biology – Metabolic rate. From : https://www.bbc.com/bitesize/guides/zg2xxnb/revision/1
Figures
- Figure 1 – Wikipedia. National_animals_of_the_Levant. https://upload.wikimedia.org/wikipedia/commons/5/50/National_animals_of_the_Levant.JPG
- Figure 2 – Illustration made by Oanelle Gleonec
- Figure 3 – Illustration made by Oanelle Gleonec
- Figure 4 – Illustration made by Oanelle Gleonec
- Figure 5 – Illustration made by Oanelle Gleonec
- Figure 6 – Illustration made by Oanelle Gleonec
- Figure 7 – Rollroboter. Wikipedia. Modifizierte Azanfärbung: Kollagenes Bindegewebe blau. Nebenhoden. https://commons.wikimedia.org/wiki/File:Hist.Technik_(2).jpg
- Figure 8 – Sunshineconnelly. Wikipedia. Anatomy and physiology of animals loose connective tissue. https://commons.wikimedia.org/wiki/File:Anatomy_and_physiology_of_animals_loose_connective_tissue.jpg
- Figure 9 – BruceBlaus. Wikipedia. Dense Irregular Connective Tissue. https://commons.wikimedia.org/wiki/File:Blausen_0296_DenseIrregularCT.png
- Figure 10 – Emmanuelm. Wikipedia. Histological image of hyaline cartilage stained with haematoxylin & eosin, under polarized light. https://commons.wikimedia.org/wiki/File:Cartilage_polarised.jpg
- Figure 11 – SEER. Wikipedia. Compact bone & spongy bone. https://commons.wikimedia.org/wiki/File:Illu_compact_spongy_bone.jpg
- Figure 12 – John Alan Elson. Wikipedia Chicken red blood cells magnified 1000 times. https://commons.wikimedia.org/wiki/File:Chickenrbc1000x.jpg
- Figure 13 – Illustration made by Leopoldine Taïrou
- Figure 14 – CNX OpenStax. Wikipedia. Biology. https://commons.wikimedia.org/wiki/File:Figure_33_02_12abc.jpg
- Figure 15 – Illustration made by Oanelle Gleonec
- Figure 16 – Illustration made by Oanelle Gleonec
- Figure 17 – Illustration made by Oanelle Gleonec
- Figure 18 – Illustration made by Leopoldine Taïrou
- Figure 19 – CNX OpenStax. Wikipedia. Biology. https://commons.wikimedia.org/wiki/File:Figure_33_02_12abc.jpg
- Figure 20 – Jonathan Haas, Juoj8. Wikipedia. 1: Unipolar neuron 2: Bipolar neuron 3: Multipolar neuron 4: Pseudounipolar neuron. https://commons.wikimedia.org/wiki/File:Neurons_uni_bi_multi_pseudouni.svg
- Figure 21 – Holly Fischer. Wikipedia.Glial cell type.This image shows the four different types of glial cells found in the central nervous system: Ependymal cells (light pink), Astrocytes (green), Microglial cells (red), and Oligodendrocytes (functionally similar to Schwann cells in the PNS) (light blue). https://commons.wikimedia.org/wiki/File:Glial_Cell_Types.png
- Figure 22 – OpenStax. Wikipedia.Overview of Nervous System. https://commons.wikimedia.org/wiki/File:1201_Overview_of_Nervous_System.jpg
- Figure 23 –
- Pixabay. Etoile de mer vacances. https://cdn.pixabay.com/photo/2018/08/24/14/20/starfish-3628041_960_720.jpg
- Furryscaly. Bilateral Symmetry. https://c1.staticflickr.com/2/1076/603093359_5094c34fed_b.jpg
- Figure 24 – Illustration made by Oanelle Gleonec
- Figure 25 – Illustration made by Oanelle Gleonec
- Figure 26 – Illustration made by Oanelle Gleonec
- Figure 27 – Illustration made by Oanelle Gleonec
- Figure 28 – Illustration made by Carlotta Zanon
- Figure 29 – Illustration made by Carlotta Zanon
- Figure 30 – Illustration made by Carlotta Zanon
- Figure 31 – Illustration made by Carlotta Zanon
- Figure 32 – Illustration made by Carlotta Zanon
- Figure 33 – pxhere. Paysage la nature branche neige hiver oiseau aile ciel blanc faune la glace le bec congelé bleu faune des oiseaux Pigeons animaux vertébré bouvreuil Oiseau perchoir Emberizidae Pigeons et colombes Colombe Cappodocia. From : https://pxhere.com/fr/photo/737077
- Figure 34 – wikipédia. Pacific walrus bull odobenus rosmarus. From : https://en.wikipedia.org/wiki/Walrus#/media/File:Pacific_walrus_bull_odobenus_rosmarus.jpg
- Figure 35 – Illustration made by Carlotta Zanon
- Figure 36 – pxhere white puppy dog animal cute canine pet mammal nose golden retriever vertebrate labrador retriever tongue adorable dog breed retriever cute dog dog like mammal dog breed group: https://pxhere.com/en/photo/784642
- Figure 37 – pixabay. Criquet Pèlerin, Schistocerca Gregaria, Sauterelle :https://pixabay.com/fr/criquet-p%C3%A8lerin-schistocerca-gregaria-1820865/
- Figure 38 – Illustration made by Léopoldine Taïrou. Icons’ references : Cat by Llisole, Mouse by Alina Oleynik, ProjectDog by Llisole, Person by Bob Smith, Horse by Rfourtytwo, Elephant by Iconic from the Noun Project.
- Figure 39 – Illustration made by Léopoldine Taïrou. Icons’ references : Woman by dDara, Peguin by Iconic,Mouse by Iconic, Snake by Alfonso López-Sanz from the Noun Project

.jpg)